LLM Observability: Monitoring LLM Apps
On this page
Learning Objective
Describe what an LLM system needs to record beyond conventional metrics, traces, and logs, explain why quality must be measured on live traffic rather than only offline, and design a trace that makes a user complaint resolvable in minutes instead of days.
Concept Explanation
Conventional observability answers whether the system is up, fast, and error-free, and an LLM system needs all of that unchanged. What it also needs is an answer to a question conventional tooling cannot even express: is the system producing good output. The first lesson of this course established why - a wrong answer returns HTTP 200 with normal latency and normal token counts - so every signal that traditional monitoring watches is green during the failure mode that matters most. LLM observability is therefore not a different set of tools so much as an additional dimension of quality layered onto the three familiar ones, plus a cost dimension that conventional systems rarely need to track per request.
The atomic unit is the trace, and it must span the whole pipeline rather than the model call alone. A useful trace records the request and session identifiers, the tenant and user, the original and rewritten query, the retrieval filters and the candidate identifiers with their scores, the post-rerank ordering, the prompt identifier and version, the fully assembled prompt with its token count, the model and parameters, the raw output, input and output token counts, timings for each stage including time to first token, the guardrail outcomes, any tool calls with their arguments and results, and the final response. With that, a complaint about a specific bad answer is resolvable in minutes because you can see precisely which stage failed. Without it, the investigation reduces to guessing, and the team changes the prompt because it is the only lever that feels adjustable.
Metrics fall into four families. Operational metrics are the familiar ones with LLM-specific additions: request rate, error rate, time to first token and total duration as separate series, timeout and retry rates, provider error rates broken out by provider. Cost metrics are input and output tokens per request tagged by tenant, feature, model, and prompt version, plus cache hit rates per caching layer, since those directly explain cost movements. Quality metrics are the ones conventional systems lack: groundedness or citation validity rates on sampled traffic, refusal and no-relevant-context rates, schema violation rates, guardrail block rates by category, retrieval recall on the labelled subset, and user feedback signals. Behavioral metrics capture what users do: thumbs up and down, copy actions, regeneration requests, follow-up questions immediately restating the same thing, escalation to a human, and abandonment, all of which are quality proxies available on every request rather than on a sample.
Sampling for online quality evaluation is what closes the gap between offline evals and production reality. The offline suite tells you whether a change regressed against a fixed dataset; it cannot tell you whether the live traffic distribution has shifted away from that dataset. Running a fraction of production traffic through model-graded checks for groundedness and answer relevance, and routing a smaller fraction to human review, produces a continuously updated quality signal on the real distribution. It also generates the labelled examples that keep the offline dataset representative and that re-validate the judge, which is the feedback loop that keeps the whole evaluation apparatus honest rather than slowly drifting away from what users actually ask.
Two practical concerns complete the picture. Data governance applies to the traces themselves: prompts and completions frequently contain personal or regulated data, so traces need redaction at capture, a retention policy, and access controls, and the observability store is a system of record that must appear in your data inventory rather than being an invisible side channel. And LLM traces are enormous compared with conventional ones, so full-fidelity storage of every prompt and completion at high volume is expensive; the usual resolution is to always retain structured metadata, identifiers, scores, token counts, timings, and outcomes, while sampling full prompt and completion text, with sampling biased toward errors, guardrail blocks, negative feedback, and high-cost requests, which are exactly the ones anyone will want to read.
| Signal Family | Examples | What It Answers | Conventional Equivalent |
|---|---|---|---|
| Operational | Time to first token, total duration, retries, provider errors | Is the system responsive and reachable? | Exists already, plus LLM-specific latency split |
| Cost | Input and output tokens by tenant, feature, model, prompt version; cache hit rates | What is this costing and why did it change? | Rarely tracked per request in conventional systems |
| Quality | Groundedness, citation validity, refusal rate, schema violations, guardrail blocks | Is the output actually correct and safe? | No equivalent; must be constructed |
| Behavioral | Thumbs down, regeneration, repeated question, escalation, abandonment | Do users find the output useful? | Partial equivalent in product analytics |
Worked Example: A Trace That Resolves a Complaint in Minutes
Compare what the two investigations below actually cost. The difference is not tooling sophistication, it is whether the intermediate state of each stage was recorded at the time.
# The captured trace for one request:
{
  "trace_id": "01JD8K2...", "session_id": "s_9f21",
  "tenant_id": "t_4410", "user_id": "u_88", "prompt_version": "grounded_answer@7",

  "query": {
    "original":  "and what about the annual one?",
    "rewritten": "What is the refund window for annual subscription plans?"
  },
  "retrieve": {
    "filters": {"tenant": "t_4410", "archived": false},
    "strategy": "hybrid_rrf", "candidates": 50, "duration_ms": 71,
    "top": [["c_8812", 0.81], ["c_7734", 0.79], ["c_9001", 0.77]]
  },
  "rerank": {
    "model": "rerank-v3", "duration_ms": 184,
    "kept": [["c_7734", 0.93], ["c_8812", 0.61]],
    "dropped_below_floor": 48
  },
  "prompt": {"tokens": 4180, "cached_prefix_tokens": 3900, "chunks_dropped": 0},
  "generate": {
    "model": "sonnet", "ttft_ms": 540, "total_ms": 3810,
    "input_tokens": 4180, "output_tokens": 233, "finish_reason": "stop"
  },
  "guardrails": {"schema": "pass", "citations": "pass", "safety": "pass"},
  "output": {"status": "ok", "citations": ["c_7734"]},
  "feedback": {"rating": "down", "at": "2026-02-11T10:04:22Z"}
}

# WITH the trace - the investigation is a read, not a search:
#   rewrite ok -> retrieval returned c_7734 -> rerank ranked it first ->
#   it reached the prompt -> the model cited it -> so the retrieval stack
#   worked and the CHUNK ITSELF is wrong or outdated. Open c_7734.
#   Elapsed: minutes. Fix: the source document, not the prompt.

# WITHOUT the trace - all you have is the question and the bad answer.
#   Was the rewrite wrong? Was the chunk retrieved? Did the reranker drop it?
#   Did budget truncation remove it? Did the model ignore it? Five hypotheses,
#   none testable after the fact, and the request is not reproducible because
#   the system is non-deterministic. Elapsed: days. Fix: someone edits the
#   prompt and hopes.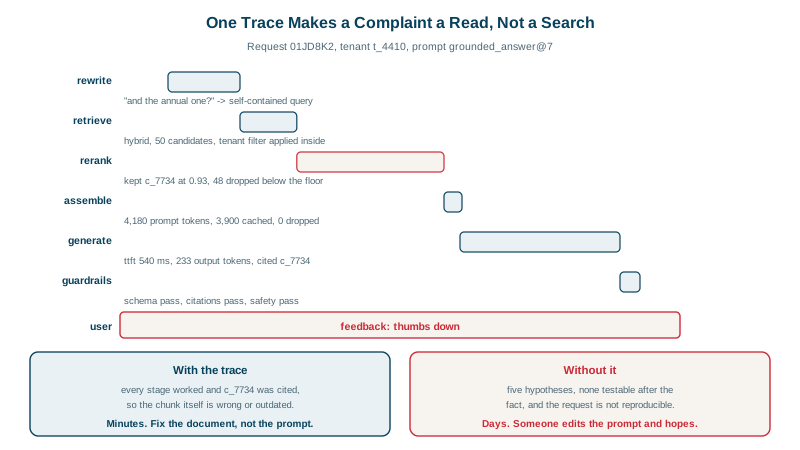
Real-World Examples
- The OpenTelemetry project has developed semantic conventions for generative AI, defining standard span and attribute names for model calls, token usage, and related operations, so that LLM traces can live in the same tracing infrastructure as the rest of a distributed system rather than in a parallel silo. Its existence reflects the convergence on treating model calls as ordinary instrumented spans carrying a few extra domain-specific attributes.
- A category of LLM-specific observability tools including LangSmith, Langfuse, Arize Phoenix, and Weights and Biases Weave emerged rapidly from 2023 onward, and the common feature set across otherwise competing products is telling: full prompt and completion capture, per-stage tracing, token and cost attribution, online evaluation on sampled traffic, and user feedback collection, which is essentially the list of things conventional application performance monitoring does not provide.
Review Questions & Answers
Because the dominant failure mode produces no signal in any existing metric. A confidently wrong answer returns a 2xx status, completes in typical time, consumes typical tokens, and is well-formed, so error rates, latency distributions, and saturation all look healthy. Quality has to be constructed as its own signal through groundedness and citation-validity checks on sampled traffic, refusal and no-context rates, schema violation and guardrail block rates, and behavioral proxies such as thumbs-down and regeneration. None of those can be inferred from operational telemetry, which is why adding an LLM feature to an existing system means adding a dimension rather than adding dashboards.
It must capture the state at every stage: the original and rewritten query, the retrieval filters and candidate identifiers with scores, the post-rerank ordering and what fell below the relevance floor, the prompt version and assembled token count and anything dropped by budgeting, the model parameters, the raw output, guardrail outcomes, and any tool calls. This matters because the stages are sequential and a failure at any one of them produces the same visible symptom, a bad answer. With the intermediate state recorded, the investigation is a read that identifies the responsible stage directly. Without it, the request cannot even be reproduced, because the system is non-deterministic, so every hypothesis is untestable.
Because the offline suite measures performance against a fixed dataset, and the live traffic distribution moves away from that dataset continuously as products change, users learn new behaviors, and new content enters the corpus. A change can pass every offline check and still degrade real outcomes because the questions users now ask are not the questions the dataset contains. Grading a fraction of live traffic produces a quality signal on the actual distribution, and the sampled cases and human labels it generates are what keep the offline dataset representative and re-validate the judge, closing the loop between the two.
Because they are available on every request at no cost, whereas model-graded and human evaluation are available only on a sample. A user who immediately regenerates, rephrases the same question, copies nothing, escalates to a human, or abandons the session is expressing dissatisfaction without ever pressing a rating control, and explicit ratings are submitted by a small and unrepresentative minority. Aggregated across traffic these signals detect a quality regression quickly and can be segmented by tenant, feature, and prompt version, which makes them an effective early alarm that then directs the more expensive evaluation methods at the right subset.