gRPC Observability: Tracing and Metrics
On this page
Instrumenting gRPC in one place
Every gRPC call passes through the same machinery, which makes instrumentation unusually easy: add it once to the server and client, and every method is covered. The course's logging interceptor (Day 16) was a simple version:
unary /shop.v1.OrderService/GetOrder code=OK took=0s
unary /shop.v1.OrderService/GetOrder code=NotFound took=0s
unary /shop.v1.OrderService/GetOrder code=Canceled took=500ms
Method, status code and duration on every call: the raw material for metrics. In production, use OpenTelemetry rather than hand-written logging.
OpenTelemetry stats handlers for grpc-go
The otelgrpc package plugs in as a stats handler, which sees every RPC event (start, messages, end) on both servers and clients:
import "go.opentelemetry.io/contrib/instrumentation/google.golang.org/grpc/otelgrpc"

srv := grpc.NewServer(grpc.StatsHandler(otelgrpc.NewServerHandler()))

conn, err := grpc.NewClient(target,
	grpc.WithTransportCredentials(creds),
	grpc.WithStatsHandler(otelgrpc.NewClientHandler()))
With an OpenTelemetry SDK configured (see the observability course), this gives you:
- A span per call, named after the method (
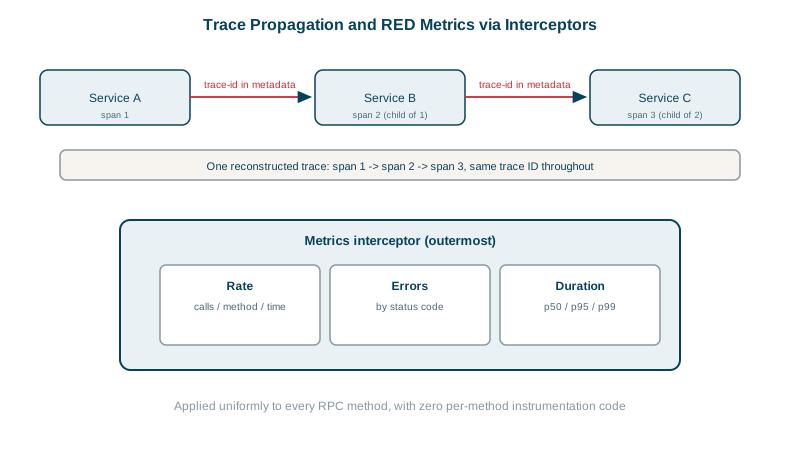
shop.v1.OrderService/GetOrder), withrpc.system=grpc,rpc.service,rpc.methodandrpc.grpc.status_codeattributes. - Trace context propagated in metadata (the
traceparentheader), so a call from checkout to orders to inventory forms one trace. - Metrics: call duration histograms on servers and clients, labeled by method and status code, plus message counts and sizes.
grpc-go also ships its own OpenTelemetry metrics plugin (google.golang.org/grpc/stats/opentelemetry), and Java, C++ and Python have equivalent integrations.
gRPC metrics to measure
Per method, the RED signals (see the observability course):
- Rate: calls per second, by method.
- Errors: calls by status code. Group codes into client errors (
INVALID_ARGUMENT,NOT_FOUND,PERMISSION_DENIED) and server errors (INTERNAL,UNAVAILABLE,UNKNOWN,DEADLINE_EXCEEDED); alert on the second group, since the first often reflects caller behavior. - Duration: latency histograms by method, measured on both sides. Client-side latency minus server-side latency shows network and queueing time.
For streams, also track active streams, stream duration, and messages per stream.
Useful extras: caller labels, deadlines, channelz
- Caller identity as a label (the calling service from mTLS or a token) answers "who's sending the failing traffic?" and "who still uses v1?" (Day 23). Keep it bounded: service names, not user IDs.
- Deadline information: log the remaining deadline at the start of a handler to find callers giving too little time.
- Channelz (
google.golang.org/grpc/channelz) exposes live connection and subchannel state for debugging load balancing (Day 18). - Log correlation: put the trace ID in every log line (see the observability course on correlating signals).
gRPC alerts worth setting
- Server error ratio per method above its SLO burn rate.
- p99 latency per method above target.
UNAVAILABLEspikes on clients: often a dependency or load-balancing problem.- Rising
DEADLINE_EXCEEDED: upstream latency, or deadlines set too tight.
Check yourself
It covers every method on every server and client automatically, with consistent metric names and labels, and new RPCs are instrumented without anyone remembering to add code.
Codes like INVALID_ARGUMENT or NOT_FOUND often come from callers' mistakes and aren't your outage, while INTERNAL, UNAVAILABLE and DEADLINE_EXCEEDED indicate problems in your service. Mixing them makes alerts noisy and hides real failures.
The client stats handler injects the trace context into call metadata, and the server's handler extracts it to parent its span.
Calls per method, status code counts and latency distributions on both client and server sides, plus active streams for streaming RPCs.
Runtime details about channels, subchannels and sockets, such as connection state, call counts, failures and last activity. It's useful for debugging connectivity and load balancing problems that metrics don't explain.