When Caching Makes Performance Worse
On this page
Learning Objective
Recognize the situations where adding a cache reduces reliability, increases cost, or hides a problem instead of solving it, and apply a short set of tests before introducing a cache to determine whether it will actually help.
Concept Explanation
Caching is treated as an unambiguous good in a way few other architectural decisions are, which is precisely why it gets added in places it does not belong. A cache is not free performance; it is a second copy of your data, a new component in the request path, a new failure mode, a new source of correctness bugs, and a new thing to operate. It pays for all of that when the hit rate is high, the data tolerates staleness, and the origin work being avoided is genuinely expensive. When any of those three conditions is absent, the cache is a net negative, and the most common way systems get worse is that nobody checked.
The first situation where caching hurts is a low hit rate. Every request now pays the cache lookup, the network round trip to the cache tier, and deserialization, and on a miss it pays all of that plus the original work plus the cost of writing the result back. At a 20 percent hit rate you have added latency to 80 percent of requests to save it on 20, and unless the origin operation is dramatically more expensive than the cache round trip, the arithmetic does not work. Low hit rates come from a keyspace far larger than the cache, from data with poor reuse such as per-user unique queries, and from TTLs so short that entries expire before they are read a second time. Measuring hit rate per key pattern rather than globally is what reveals this, because a single global number hides the fact that one pattern is at 99 percent and another at 3 percent.
The second is caching cheap work. If a query runs in one millisecond against a warm index, adding a cache tier that responds in 0.4 milliseconds over the network saves almost nothing while adding an entire distributed component. This is common because caching gets applied uniformly at a framework level rather than to the specific expensive operations that motivated it. The database buffer pool is itself already a cache, and a well-indexed point lookup on a hot table is served from memory; putting a network hop in front of a memory read is frequently a downgrade. The corollary is that caching hides a missing index rather than removing the need for one, and when the cache is eventually cold, after a restart or a failover, the unindexed query underneath is still there and now it is serving full production traffic.
The third and most dangerous is that a cache can become a load-bearing dependency without anyone deciding that it should be. A cache added as an optimization makes the origin comfortable, so the origin is never scaled to handle full traffic, and over time the cache moves from making the system fast to making it possible. The system now has a hidden requirement that the cache hit rate stay high, and nothing enforces or monitors that requirement. Then a cache node is lost, a deploy changes a key format, or a TTL expires en masse, and the origin receives traffic it has never seen and cannot serve. The system was fine right up until it was not, and the failure is total rather than gradual. The test for this is uncomfortable and worth running deliberately: if the cache went to a zero percent hit rate right now, what would happen? If the answer is a total outage, the cache is a single point of failure that is being reported in dashboards as an optimization.
There are further cases worth naming. Caching data that must be strictly consistent, such as an account balance used for an authorization decision or an inventory count that determines whether a sale completes, introduces a correctness risk that is rarely worth the latency saved, and the usual outcome is a TTL so short it produces no hits. Caching highly personalized responses at a shared layer produces near-zero reuse and creates a real risk of serving one user data to another if the key scheme is ever wrong, which is a security incident rather than a performance regression. Caching very large objects can evict a huge number of small hot ones and reduce the overall hit rate. And caching can mask a capacity problem so effectively that the team stops seeing the growth curve until it arrives all at once. The discipline is to treat a new cache as a component requiring justification, with a measured hit rate target, a stated staleness tolerance, and an explicit answer for what happens when it is empty.
| Situation | Why the Cache Hurts | What to Do Instead |
|---|---|---|
| Hit rate below roughly 50 percent | Most requests pay lookup plus miss plus write-back and gain nothing | Measure per key pattern; cache only the patterns with real reuse |
| Origin operation is already fast | A network hop replaces a memory read for no gain | Fix indexing and query shape; let the buffer pool do its job |
| Data requires strict consistency | Any staleness is a correctness bug, so the TTL collapses to near zero | Read from the source, or cache only derived data that tolerates lag |
| Highly personalized responses | Near-zero reuse plus a real risk of cross-user leakage on a key bug | Cache the shared fragments; assemble the personalized part per request |
| Origin cannot survive a cold cache | The cache silently became a single point of failure | Size the origin for degraded operation, or add admission control |
| Very large objects in a shared tier | One entry evicts many hot small ones and the hit rate drops | Separate tiers or size classes; consider not caching large objects |
Worked Example: The Break-Even Calculation Nobody Runs
Before adding a cache, the expected latency with and without it can be written down in two lines, and doing so frequently ends the discussion. The second half of the example shows the more important question, which is not about latency at all.
# Expected latency WITHOUT a cache:
#   E_nocache = T_origin
#
# Expected latency WITH a cache:
#   E_cache = T_lookup + h * 0            (hit: lookup only)
#           + (1-h) * (T_origin + T_write)  (miss: lookup, origin, populate)
#
# Caching helps only when:
#   T_lookup + (1-h)*(T_origin + T_write)  <  T_origin

# --- Case A: expensive aggregation query, good reuse ---
T_origin = 800ms   T_lookup = 0.4ms   T_write = 0.5ms   h = 0.92
E_cache  = 0.4 + 0.08 * 800.5 = 64.4ms    vs 800ms
# ~12x better. Obviously worth it.

# --- Case B: indexed point lookup, poor reuse ---
T_origin = 1.2ms   T_lookup = 0.4ms   T_write = 0.5ms   h = 0.20
E_cache  = 0.4 + 0.80 * 1.7 = 1.76ms      vs 1.2ms
# ~47% SLOWER, plus a whole distributed component to operate, plus a
# staleness window, plus an invalidation obligation. Strictly negative.

# --- The question that matters more than latency ---
# origin_capacity   = 12,000 queries/sec  (measured, not assumed)
# production_reads  = 90,000 requests/sec
# hit_rate          = 0.94
# origin_load_now   = 90,000 * 0.06 = 5,400 q/s   -> comfortable
# origin_load_cold  = 90,000        = 90,000 q/s  -> 7.5x over capacity
#
# The cache is not an optimization. It is load-bearing, and the system
# cannot survive losing it. That is a legitimate architecture, but only
# if it is a DECISION, which means:
#   - the cache tier is replicated and its failure is drilled
#   - hit rate is alerted on as a capacity metric, not a vanity metric
#   - the origin has admission control so a cold cache degrades instead
#     of collapsing
#   - key-format changes are rolled out with dual-read, never big-bang
# If none of those exist, the cache is an undeclared single point of failure.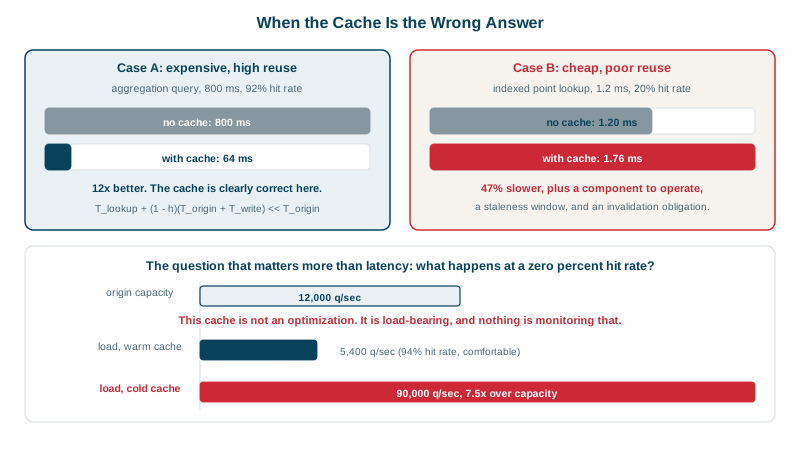
Real-World Examples
- Amazon Builders Library article on caching challenges and strategies states the load-bearing problem directly, describing how a cache that reduces load can hide the fact that a service has no capacity to operate without it, and recommending that teams deliberately test behaviour at a zero percent hit rate and consider whether the service should be provisioned to survive that. The same article discusses modal behaviour, where a system has two very different operating modes, warm and cold, and only one of them is ever exercised in normal operation or in testing.
- The 2010 Facebook outage discussed in the previous lesson is also an instance of this failure class: the site depended on cache to such a degree that when the cached configuration value was invalidated fleet-wide, the database could not absorb the resulting re-fetch volume, and engineers had to take the site fully offline to break the loop. The dependency on a high hit rate was real and total, and it was not visible in any normal operating metric until the moment the hit rate went away.
Review Questions & Answers
A cache increases average latency whenever the lookup cost plus the miss-path cost exceeds the original operation cost, which happens when the hit rate is low and the origin operation is already cheap. Concretely, if the origin takes a millisecond and the cache round trip takes half a millisecond, a hit rate below roughly fifty percent makes the cached path slower on average, because the majority of requests pay the lookup, then the origin anyway, then the write-back. A global hit rate hides this because it aggregates across key patterns with completely different reuse characteristics. A service can show 85 percent overall while one high-volume pattern sits at 5 percent and is actively harmed, with the global figure carried by a different pattern near 99 percent. Hit rate must be measured per key prefix or per query type to be actionable.
The cache is introduced as an optimization while the origin can still serve full traffic. The origin then never needs to be scaled, because the cache absorbs the growth, and traffic increases by an order of magnitude with the origin unchanged. At no point does anyone make a decision that the origin should no longer be able to serve production volume, but that becomes true, and the only thing preventing an outage is the hit rate staying high. Nothing monitors that as a capacity constraint, because hit rate is usually treated as a performance metric. It should be alerted on as a capacity metric with a threshold derived from actual origin capacity: if origin capacity is 12,000 queries per second and production is 90,000 requests per second, any sustained hit rate below about 87 percent means the origin is being overrun, and that number should be the alert threshold rather than some round figure chosen by intuition.
Because the only way to make it safe is to shrink the staleness window toward zero, and a cache with a near-zero TTL provides almost no hits, so you end up paying the full cost of the cache, the lookup latency, the infrastructure, the invalidation complexity, the correctness risk, while receiving nearly none of the benefit. Teams arrive here incrementally: they cache the value, discover a consistency bug, reduce the TTL, discover another, reduce it again, and end up with a five second TTL on data read once per minute per user, which means essentially every read is a miss. The better answer is usually to read strongly consistent data from the source and to cache instead the derived or contextual data around it that genuinely tolerates lag, so the expensive parts of the response are cached and the one field that must be exact is not.
Several things that the latency graph does not show. First, whether the underlying cause was actually addressed or merely hidden: if the improvement came from caching an unindexed query, the missing index is still missing and will reappear on any cold start. Second, what the origin load looks like now and what it would look like at a zero hit rate, since a large drop in origin load means the origin is now unexercised and its true capacity is unknown. Third, the per-pattern hit rate, to confirm the win is broad rather than one pattern carrying the average. Fourth, the new worst-case staleness and whether any of the cached data has a correctness requirement tighter than that. Fifth, what happens operationally when the cache tier is restarted, failed over, or has its key format changed by a deploy. A p99 improvement is evidence that the cache is working, not evidence that the system is better off overall.