Hot Keys and Hot Partitions Explained
On this page
Learning Objective
Explain why real-world access distributions are power-law rather than uniform, distinguish a hot key from a hot partition, and recognize the specific monitoring signatures that identify a hot spot while aggregate dashboards continue to look healthy.
Concept Explanation
Every capacity model that assumes uniform access is wrong, and the error is not small. Real access distributions follow a power law: a small fraction of keys receives a large fraction of the traffic, and the skew tends to get more extreme as the system gets more popular, not less. A Zipf-like distribution over a million products means the top item can easily receive thousands of times the traffic of the median one. Sharding and caching both assume they can divide load by dividing keys, and that assumption holds only to the extent that traffic per key is comparable. When it is not, the division is nominal: you have sixteen shards and one of them is doing most of the work.
It is useful to separate two related but distinct problems. A hot key is a single item receiving disproportionate traffic: one product during a flash sale, one celebrity profile, one configuration entry read on every request, one lock key. Because a key lives on exactly one shard or cache node by construction, a hot key cannot be spread by adding capacity. Doubling the shard count leaves that key exactly where it was, serving the same load on the same machine. This is the crucial property: a hot key is immune to horizontal scaling, which is why it is the failure mode that defeats otherwise well-designed systems. A hot partition is a shard or partition receiving disproportionate traffic, which can be caused by a single hot key inside it or, more often, by the shard key correlating with access patterns, such as time-ordered keys sending all new writes to the newest partition, or a tenant-based key where one enterprise tenant is a thousand times larger than the median.
The symptoms are what make hot spots insidious, because aggregate metrics conceal them almost perfectly. Mean latency across the fleet stays fine, since most shards are idle. Total throughput looks correct. Overall CPU utilization across the cluster might sit at 30 percent while one node is pinned at 100. What actually shows up is a rising tail: p99 and p999 latency climb while p50 does not move, because only requests unlucky enough to touch the hot partition are slow. Errors cluster on a subset of keys. Queue depth or connection count is uneven across instances. And a shard-level or key-level view is the only place any of this is visible, which is why monitoring designed around cluster averages will faithfully report a healthy system during an outage affecting a meaningful fraction of users.
The causes are worth cataloguing because they recur. Natural popularity skew is the baseline and is unavoidable. Temporal correlation is next: an auto-increment or timestamp shard key puts all current activity on one partition regardless of how well distributed the historical data is. Low-cardinality keys, such as sharding by status or country, guarantee that the dominant value is a permanent hot spot. Metadata and configuration keys read on every request are hot by construction, and they are easy to miss because they are small. Lock and counter keys concentrate contention by design. Retry storms manufacture hot spots dynamically: a key that starts responding slowly triggers client retries, which increase load on that key specifically, which makes it slower. And a phenomenon worth naming separately is the rebalance-induced hot spot, where removing or adding a node causes the departing node keys to land on a single successor, which is precisely the problem virtual nodes exist to prevent.
Detection has to be deliberate. The instruments that work are per-key sampling at the cache or proxy layer to find the top-N keys by request rate, per-shard metrics rather than cluster aggregates, per-partition throughput consumption where the database exposes it, and latency histograms segmented by shard. It also pays to track the ratio of maximum to median shard load as a single number, because it compresses the entire question into one time series that is easy to alert on and that a cluster average can never surface.
| Cause | Typical Shape | How It Surfaces | Whether Adding Capacity Helps |
|---|---|---|---|
| Natural popularity skew | One key, orders of magnitude above the median | Tail latency on one shard; hit rate fine overall | No; the key stays on one node |
| Temporal key correlation | One partition takes all writes | Write latency rises while other shards idle | No; the newest range is still one partition |
| Low-cardinality shard key | A permanent skew fixed by the data | Persistently uneven shard utilization | No; the ceiling is the number of distinct values |
| Config or metadata key | One small key read on every request | Cache node CPU saturated on one slot | No, but local caching does |
| Lock or counter contention | Serialized access to one key | Rising wait time, flat throughput | No; the contention is on the key itself |
| Retry storms | A key that got slow and now gets slower | Load on one key rising with no traffic change upstream | No; retries scale with the failure |
| Rebalance fallout | A departed node load landing on one successor | A sudden hot node right after a membership change | Yes, if virtual nodes are used |
Worked Example: Finding the Hot Partition the Dashboard Is Hiding
The numbers below are what a real investigation looks like. The top block is what the aggregate dashboard shows and it is entirely unremarkable; every line after it is a view the default dashboard does not provide.
# --- What the cluster dashboard shows (all green) ---
#   requests/sec        184,000
#   mean latency        4.2 ms
#   cluster CPU         31%
#   error rate          0.4%
# Nothing here is actionable. Nothing here is wrong. And users are
# complaining.

# --- Percentile view: the first real signal ---
#   p50    3.1 ms      unchanged over 30 days
#   p95    9.4 ms      unchanged
#   p99   altered:  11 ms  ->  840 ms     over the last 6 hours
#   p999             18 ms  -> 4,100 ms
# A moving tail with a flat median means a SUBSET of requests is slow,
# not the system. That subset is almost always a shard or a key.

# --- Per-shard view: the cause becomes obvious ---
#   shard   req/sec   CPU    p99
#   --------------------------------
#   00       11,400   28%    9 ms
#   01       11,900   30%    9 ms
#   ...
#   07      112,000   99%  2,900 ms     <-- here
#   ...
#   15       11,100   27%    9 ms
#
#   max_shard_load / median_shard_load = 112,000 / 11,400 = 9.8
#   Track THIS as one time series and alert above ~3. It is the single
#   most useful hot-spot metric and no cluster average can express it.

# --- Per-key sampling on shard 07 ---
#   key                                   req/sec    share
#   product:8821:inventory                 94,200     84%
#   product:8821:detail                      6,100      5%
#   everything else                         11,700     11%
# One key is 84% of a shard that is 10x its peers. This is a hot KEY
# inside a hot PARTITION, and adding shard 16 through 31 would change
# nothing at all: product:8821 would still hash to exactly one of them.

# --- Confirm it is not a retry storm amplifying itself ---
#   upstream requests for product 8821:   9,400/sec
#   requests reaching the shard:         94,200/sec
#   amplification factor:                   10.0x
# The real demand is 9,400/sec. Clients are retrying ~10 times because
# the key is slow, which is what is making it slow. Fixing the key helps;
# so does capping retries and adding a circuit breaker, and the second
# fix is available immediately while the first is a design change.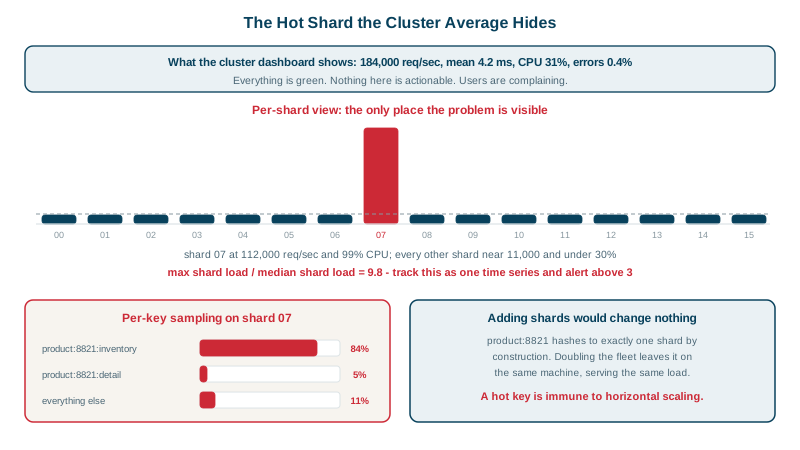
Real-World Examples
- Amazon documents hot partitions as a first-class operational concern for DynamoDB, explaining that throughput is provisioned per partition rather than per table and that a partition key with uneven access can throttle requests while the table as a whole is far below its provisioned capacity. The service subsequently added adaptive capacity to shift throughput toward hot partitions automatically, which is itself an acknowledgement that uneven access is the normal case rather than a pathological one.
- Discord described in its 2023 engineering post on storing trillions of messages that hot partitions were a recurring problem in its Cassandra deployment, where large or highly active channels would concentrate traffic on specific partitions and produce latency spikes that affected nodes far beyond the channel involved, because those nodes were shared. The published account is a clear demonstration of the blast radius property: a hot partition does not degrade only the hot data, it degrades everything co-located with it.
Review Questions & Answers
General overload affects every request, because the resource under pressure is shared, so the whole latency distribution shifts and the median moves along with the tail. A hot spot affects only requests that touch the hot key or shard, which is a small fraction of total traffic, so the median is computed almost entirely from requests that never went near the problem and does not move at all. The affected requests, being few, land in the upper percentiles, which is why p99 and p999 climb dramatically while p50 stays exactly where it was. This makes the signature diagnostic: a moving tail over a stationary median says the problem is concentrated in a subset of requests, and the next step is to find what that subset has in common, which is usually a shard, a key, a tenant, or an endpoint.
A hot partition is a shard receiving disproportionate traffic, which may be because it holds many moderately popular items, because the shard key correlates with time so all current activity lands there, or because one enormous tenant lives on it. It can often be remediated by splitting the partition, moving some of its contents elsewhere, or giving the large tenant a dedicated shard, because the load is divisible. A hot key is a single item receiving disproportionate traffic, and it is not divisible by any partitioning scheme, because the key maps to exactly one location by definition. Splitting the partition it lives in leaves the key exactly as hot as before. Its remediations are different in kind: replicate the key to multiple locations, split it artificially into subkeys that must be fanned across on read, cache it in every application process so most reads never leave the instance, or coalesce concurrent requests so only one reaches the store.
When a key begins responding slowly, clients time out and retry. Each retry is another request for that same key, so load on the key rises specifically because it is slow, which makes it slower and triggers more retries. Load increases without any change in real user demand, and the system can sit in this state indefinitely because the feedback is entirely internal. The amplification factor, the ratio of requests arriving at the store to genuine upstream requests, matters more than the raw rate during an incident because it tells you which lever works. If real demand is nine thousand per second and the store is seeing ninety thousand, the store does not need ten times the capacity, it needs the retries capped, and capping them is a configuration change available immediately, whereas redesigning the key is a project. Knowing the amplification factor is the difference between mitigating in minutes and provisioning for a load that is not real.
An absolute threshold has to be chosen for a specific fleet at a specific traffic level, so it is either too sensitive during normal peaks, generating noise, or too permissive during quiet periods, missing a severe imbalance that happens to sit below the threshold. The max-to-median ratio is normalized by construction: it says how uneven the fleet is regardless of whether total traffic is high or low, so the same threshold remains meaningful as the system grows, as traffic varies daily, and as the shard count changes. A ratio near one means the partitioning is working as intended; a ratio of ten means it is not, whether the fleet is at ten percent utilization or ninety. It also fires early, while the hot shard is still coping, which converts a hot spot from an incident into a maintenance task. It compresses the whole question into one time series that can be graphed, alerted on, and reviewed as a trend.