Redis Performance Tuning and Monitoring
On this page
- Why Redis latency spikes: a typical incident
- How to diagnose a slow Redis: four tools
- Fixing the usual causes of Redis latency
- Big keys: split them, delete them with UNLINK
- O(N) commands in request paths
- Hot keys
- Connection pooling and client timeouts
- Security: never expose Redis to the internet
- Redis metrics to monitor and alert on
- Check yourself
Why Redis latency spikes: a typical incident
Dashboards show p99 latency for every Redis call jumping from under 1 ms to almost a second, every few minutes. CPU on the Redis host is low on average. The team suspects the network. It's almost never the network.
Because Redis runs commands one at a time (Day 1), one slow command shows up as latency for everyone. So start by finding which command it is.
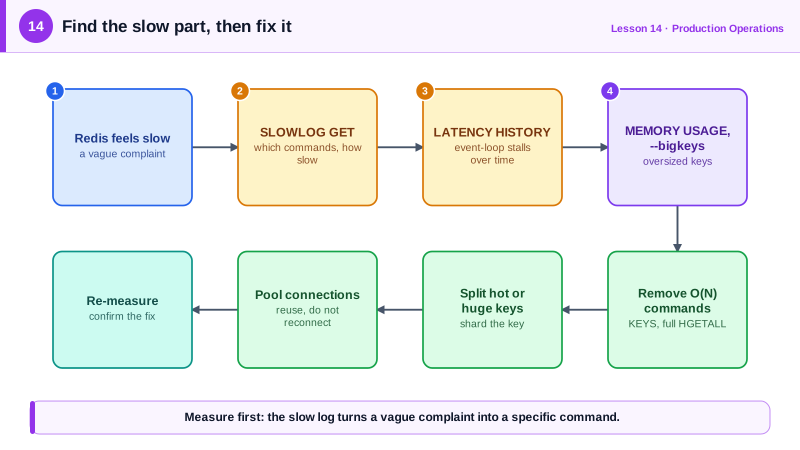
How to diagnose a slow Redis: four tools
1. The slow log. Redis records every command that takes longer than slowlog-log-slower-than microseconds (10,000, so 10 ms, by default):
SLOWLOG GET 10
# 1) 1) (integer) 812          id
#    2) (integer) 1791608337   timestamp
#    3) (integer) 803114       microseconds: 0.8 s
#    4) 1) "HGETALL"
#       2) "user_cache:all"
Execution time only counts time inside Redis, not network time, which is exactly what you want here.
2. The latency monitor. It records stalls of the event loop from any cause, including forks and expiry cycles, not just commands. It's off by default:
CONFIG SET latency-monitor-threshold 100     # record events over 100 ms
LATENCY LATEST
LATENCY DOCTOR                               # plain-language summary and advice
3. Key scans. redis-cli --bigkeys and --memkeys find the largest keys. With an LFU eviction policy (Day 13), redis-cli --hotkeys finds the most-accessed ones. All three use SCAN, so they're safe on production, though they add some load.
4. Client stats. INFO clients shows connected_clients against maxclients (10,000 by default). CLIENT LIST shows who's connected and what each connection last ran.
Fixing the usual causes of Redis latency
Big keys: split them, delete them with UNLINK
In the example, HLEN user_cache:all returns over two million fields. Every HGETALL walks all of them. No setting fixes that; the data model does. Split the hash into buckets by a hash of the user id, or better, store one small hash per user so each read touches only what it needs:
user_cache:all              one hash, 2,000,000 fields       -> HGETALL walks everything
user_cache:{user:1042}      one small hash per user          -> HGETALL reads ~10 fields
Deleting a giant key blocks too. Use UNLINK instead of DEL: it removes the key from the keyspace immediately and frees the memory in a background thread.
O(N) commands in request paths
KEYS, SMEMBERS and HGETALL on large collections, SORT without LIMIT, LRANGE 0 -1 on a long list. Replace them in request paths with SCAN, SSCAN, HSCAN or bounded ranges, and keep collections from growing without limit.
Hot keys
One extremely popular key, like a flash-sale product or a global counter, sends all its traffic to one thread on one node. Adding Cluster nodes doesn't help, because the key lives in one place (Day 8). Options:
- Cache it in the application for a second or two. Redis client-side caching (
CLIENT TRACKING, Redis 6 and later) lets the server tell clients when a cached key changes. The client keeps hot values in its own memory, and Redis remembers which keys each connection has read. When one of them changes, Redis sends that connection an invalidation message and the client drops its copy, so reads of a hot key stop leaving the application server at all. The client library has to support it, and server memory grows with the number of tracked keys unless you use broadcast mode, which tracks key prefixes instead of individual keys. - Serve reads from replicas.
- Split a hot counter into N keys (
likes:post:9:0tolikes:post:9:7), increment a random one, and sum them on read.
Connection pooling and client timeouts
Opening a new connection per request costs a TCP handshake each time, and under load it can exhaust maxclients. Serverless functions are a common source. Use one connection pool per process, size it sensibly, and set client timeouts so a stalled Redis fails fast instead of piling up requests.
In .NET, StackExchange.Redis works differently: there's no pool to size. Create one ConnectionMultiplexer per application and share it; it's thread-safe and designed to be reused, and creating one per request is the classic mistake (StackExchange.Redis docs). Its timeout errors often aren't Redis at all. If the message shows more busy worker or IOCP threads than the minimum, as in WORKER: (Busy=250,...,Min=8,...), the .NET thread pool is adding threads slowly, about one every 500 ms, and the usual root cause is blocking on async code with .Result or .Wait() (Timeouts).
Security: never expose Redis to the internet
Redis trusts whoever can reach its port. Since version 3.2, protected mode refuses outside connections when Redis listens on every interface with no password, but that's a safety net, not security. Bind Redis to private interfaces, firewall the port, require authentication with ACL users (Redis 6 and later) instead of one shared password, and turn on TLS when traffic crosses networks you don't control (Redis security docs).
Redis metrics to monitor and alert on
| Metric | Where | Alert when |
|---|---|---|
| Slow commands | SLOWLOG LEN, or the exporter's slowlog metric | New entries appear in request paths |
| Memory | used_memory against maxmemory | Above about 80 percent |
| Evictions | evicted_keys | Rising on an instance that shouldn't evict |
| Clients | connected_clients, rejected_connections | Near maxclients, or any rejections |
| Hit rate | keyspace_hits, keyspace_misses | Drops sharply after a deploy |
| Replication | master_link_status, replica lag | Link down or lag growing |
Check yourself
SLOWLOG GET, to see which command ran long at those times. Then check the latency monitor for non-command stalls such as forks.
Deleting a huge key frees all its memory on the main thread, blocking every other client while it runs. Use UNLINK, which removes the key immediately but frees the memory in a background thread. Then redesign so no single key grows that large, for example by splitting the index across several smaller keys.
A hot key on that node. Cache it briefly in the application, serve reads from replicas, or split it into several keys.
In the app. More busy threads than the minimum means the .NET thread pool is starved, usually by blocking calls such as .Result on async code. Fix the blocking code; raising the minimum thread count only hides it.
Exposed Redis instances are scanned and attacked constantly, and a compromised instance can be used to run commands, overwrite data or pivot into the network. Bind it to private interfaces, firewall it to the app servers only, use ACLs with strong passwords, and enable TLS where traffic leaves a trusted network.