Elasticsearch Aggregations Tutorial
On this page
Search facets in one request
A product listing shows results, plus "Electronics (4), Audio (2)...", price bands, and the number of brands. Aggregations compute all of that from the same query, in the same request, using doc values (column-oriented storage, Day 3).
Bucket vs metric aggregations
- Bucket aggregations group documents:
terms(by value),range,date_histogram,histogram,filters. - Metric aggregations compute numbers:
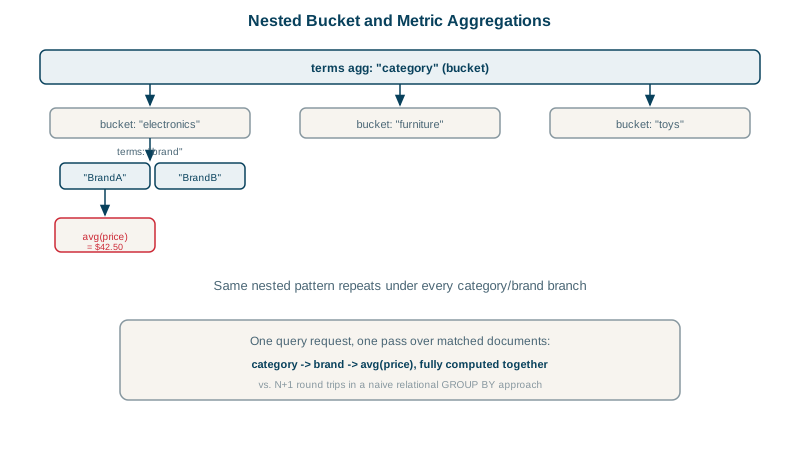
avg,sum,min,max,stats,percentiles,cardinality. - They nest: average price per category is an
avginside aterms.
Example: product facets with terms and range aggregations
GET /products/_search
{
  "size": 0,
  "query": { "bool": { "filter": [ { "term": { "in_stock": true } } ] } },
  "aggs": {
    "by_category": {
      "terms": { "field": "category", "size": 10 },
      "aggs": {
        "avg_price":  { "avg": { "field": "price" } },
        "top_rated":  { "max": { "field": "rating" } }
      }
    },
    "price_bands": {
      "range": { "field": "price", "ranges": [ { "to": 50 }, { "from": 50, "to": 300 }, { "from": 300 } ] }
    },
    "brands": { "cardinality": { "field": "brand" } }
  }
}
Run against the course's products:
  electronics  docs=4 avg_price=43.74 top_rating=4.6
  audio        docs=2 avg_price=104.00 top_rating=4.3
  computers    docs=2 avg_price=339.00 top_rating=4.0
  furniture    docs=2 avg_price=289.00 top_rating=4.4
  price bands: [('*-50.0', 3), ('50.0-300.0', 5), ('300.0-*', 2)]
  distinct brands: 6
"size": 0skips the hits when you only want the numbers (and lets the request cache help).- Aggregations run over the documents the query matched: only the 10 in-stock products here.
- Aggregate on
keyword, numeric and date fields, not analyzedtext.
Facets that don't filter themselves: post_filter
When a user picks "electronics", the results should narrow, but the category facet should still show the other categories. Put the user's facet selections in post_filter, which filters hits after aggregations run, or use a filter aggregation per facet. This is how most e-commerce faceting is built.
date_histogram aggregations for time series
"aggs": {
  "per_day": {
    "date_histogram": { "field": "added", "calendar_interval": "day" },
    "aggs": { "revenue": { "sum": { "field": "price" } } }
  }
}
The basis of every dashboard chart built on Elasticsearch (Kibana uses exactly this).
Why terms, cardinality and percentiles are approximate
termson many shards is approximate: each shard returns its top terms, and rare-on-one-shard values can be miscounted. Responses reportdoc_count_error_upper_bound; raisingshard_sizeimproves accuracy.cardinalityuses HyperLogLog++: near-exact for small counts, about 1 to 2% error at scale, in fixed memory.percentilesuse t-digest: accurate at the extremes, approximate in between.- For exact paging through every group (all customers with their order totals), use the
compositeaggregation withafter_key.
Check yourself
Bucket aggregations group documents, by term, range or date interval. Metric aggregations calculate values such as sums, averages and percentiles, often inside each bucket, like average price per category.
Apply the selection as a post_filter, or use per-facet filter aggregations. The aggregations then run on results before the category selection narrows the hits, so users still see the other categories and their counts to switch to.
Each shard sends only its top terms; values that are frequent overall but not in a shard's top list can be undercounted.
They use the HyperLogLog++ algorithm, which counts distinct values in fixed memory instead of remembering every value. precision_threshold makes counts below it near exact, at the cost of more memory per bucket.
It skips returning hits, so Elasticsearch doesn't run the fetch phase to load documents. Dashboards that only need aggregations become faster and the response much smaller.