Elasticsearch Cluster Health Monitoring
On this page
Why green isn't the same as healthy
Cluster health only says whether shards are assigned (Day 2). A green cluster can have one node at 90% heap with constant garbage collection, a disk about to hit its watermark, or a search thread pool rejecting requests. Monitor the resources underneath.
Elasticsearch metrics that matter
| Signal | API | Worry when |
|---|---|---|
| Cluster status, unassigned shards | GET /_cluster/health | Yellow for long, or any red |
| Heap used | GET /_nodes/stats/jvm | Sustained above about 75 to 85%, or frequent long GC |
| Disk free | GET /_nodes/stats/fs, _cat/allocation | Approaching the 85% low watermark |
| Thread pool queues and rejections | GET /_cat/thread_pool/search,write?v | Any growing rejected count |
| Search and indexing latency | GET /_nodes/stats/indices (query and index time totals) | Rising per-operation time |
| Pending cluster tasks | GET /_cluster/pending_tasks | A growing queue: the master is overloaded |
| Circuit breaker trips | GET /_nodes/stats/breaker | Any trips: requests rejected to avoid running out of memory |
The lab node's heap and disk, from node stats:
GET /_nodes/stats/jvm,fsnode-1 heap_used_percent=17 disk_free=50%Fine for a lab. In production, track these per node over time; one hot node in an otherwise calm cluster usually means uneven shard placement or one expensive query pattern.
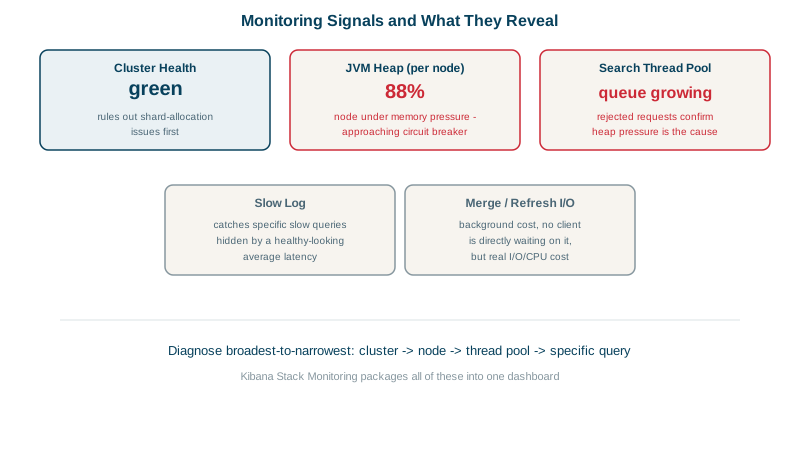
Diagnosing a slow cluster
Searches got slow at 14:00 and the cluster is green.
- Which nodes?
GET /_nodes/stats/jvmshows one node at 88% heap, the others near 50%. - What's on it?
GET /_cat/shards?v&s=store:descshows it holds several of the largest shards: placement is uneven. - What's running?
GET /_tasks?actions=*search&detailedlists long-running searches;GET /_nodes/hot_threadsshows what threads are busy. - Which queries? Enable the search slow log on the index (
index.search.slowlog.threshold.query.warn: 2s), and look for deep aggregations on high-cardinality fields, leading wildcards or hugesizevalues. - Fix: rebalance or split the large shards, fix the query, add capacity. For sustained thread pool rejections on writes, slow down bulk clients (back off on 429) rather than raising queue sizes.
Elasticsearch monitoring tools
- Stack Monitoring in Kibana, or Elastic Agent shipping metrics to a separate monitoring cluster (don't monitor a cluster only from inside itself).
- Prometheus via an Elasticsearch exporter, with Grafana dashboards and alert rules (see the observability course).
- AutoOps (Elastic Cloud) and similar services analyze clusters and suggest fixes.
Elasticsearch alerts worth having
- Health red (page) or yellow for over 15 minutes.
- Disk above the low watermark on any node.
- Heap above 85% for 10 minutes.
- Any thread pool rejections on search or write.
- p99 search latency above your target, measured from the application's side.
Check yourself
Green only means shards are assigned; heap, disk, thread pools and latency can all be problems while every shard is placed.
The node can't keep up and is refusing work; clients must back off and the cause (load, uneven shards, expensive queries) needs fixing.
If the production cluster is struggling or down, monitoring stored inside it fails at exactly the moment you need it, and the monitoring load adds to the problem.
Cluster status not green, disk above the low watermark, high heap and long GC pauses, thread pool rejections, and rising search or indexing latency.
It records searches and indexing operations that exceed configured time thresholds, with the query and the shard. That shows exactly which queries need optimizing, instead of guessing from cluster-wide latency.