MongoDB explain(): Diagnosing Slow Queries
On this page
- Symptom: a slow MongoDB endpoint
- Step 1: find slow queries with the profiler
- Step 2: run explain on the query
- Step 3: read COLLSCAN, IXSCAN, FETCH and SORT stages
- Step 4: compare keys and documents examined
- Worked example: fixing a slow query with an ESR index
- When the plan looks right but it's still slow
- Check yourself
Symptom: a slow MongoDB endpoint
The "recent orders" endpoint's p99 latency climbed from 40 ms to 1.5 s. The query looks innocent. The tools in this lesson show what MongoDB is really doing.
Step 1: find slow queries with the profiler
MongoDB logs operations slower than slowms (100 ms by default). The database profiler can also record them into a collection:
db.setProfilingLevel(1, { slowms: 50 })                       // record operations over 50 ms
db.system.profile.find().sort({ ts: -1 }).limit(5)             // most recent slow operations
Each entry shows the command, planSummary (for example COLLSCAN or IXSCAN { customerId: 1 }), keysExamined, docsExamined, nreturned and duration. In Atlas, the Query Profiler and Performance Advisor show the same data with suggested indexes. Leave profiling at level 1 with a sensible threshold; level 2 records everything and adds overhead.
Step 2: run explain on the query
db.orders.find({ customerId: 4021, status: "paid" }).sort({ placedAt: -1 }).limit(20)
         .explain("executionStats")
Three modes: queryPlanner (the chosen plan, without running), executionStats (runs it and reports counts and time), allPlansExecution (also shows the rejected candidates' trial results, Day 9).
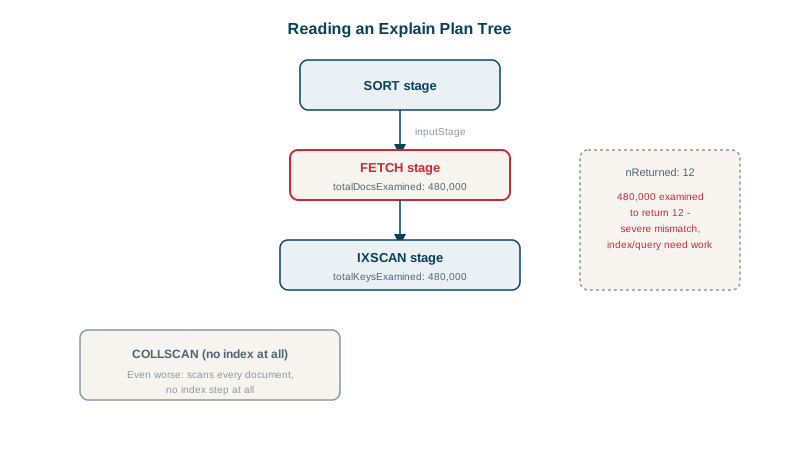
Step 3: read COLLSCAN, IXSCAN, FETCH and SORT stages
| Stage | Meaning |
|---|---|
COLLSCAN | Read every document: no usable index |
IXSCAN | Walked an index |
FETCH | Read documents for keys found in an index |
SORT | Sorted in memory: no index provided the order |
PROJECTION_COVERED | Answered from the index alone (Day 11) |
LIMIT, SKIP | Applied limit or skip |
Stages are nested: FETCH usually wraps an IXSCAN. Read from the innermost stage outward.
Step 4: compare keys and documents examined
| Pattern | Diagnosis |
|---|---|
totalDocsExamined >> nReturned | Filter not covered by an index; documents fetched then discarded |
totalKeysExamined >> nReturned | Index used, but fields in the wrong order or a range before a sort (Day 8) |
SORT stage present | No index in the right order for the sort; large sorts are slow and memory-limited |
| Keys ≈ docs ≈ returned | Efficient |
Worked example: fixing a slow query with an ESR index
The slow endpoint's explain shows:
SORT <- FETCH <- IXSCAN { customerId: 1 }
totalKeysExamined: 48210   totalDocsExamined: 48210   nReturned: 20
The index on customerId alone found all of this large customer's orders, every one was fetched to check status, then all were sorted by placedAt in memory, to return 20. Apply ESR (Day 8):
db.orders.createIndex({ customerId: 1, status: 1, placedAt: -1 })After: FETCH <- IXSCAN { customerId: 1, status: 1, placedAt: -1 }, about 20 keys and 20 documents examined, no SORT. Then drop { customerId: 1 }, now a redundant prefix.
When the plan looks right but it's still slow
If the plan looks right but the query is still slow, look at:
- Working set versus RAM: frequent cache misses mean reads go to disk (Day 26).
- Lock or write contention:
currentOpandserverStatusshow waiting operations. - Large documents: fetching big documents for a few fields; consider projection, covering or schema changes.
- Network and driver: time spent outside the server.
Check yourself
The index helps only partially: it matches the first condition but not the rest of the filter and sort, so many keys are scanned and filtered. Add a compound index following ESR.
Results were sorted in memory because no index provided that order. In-memory sorts are slower and limited in memory, failing or spilling to disk for large result sets. Add the sort field to the index, in the right position, so results come out pre-sorted.
Use the slow query log, which logs operations above slowms, or turn on the database profiler at level 1 with a slowms threshold and query system.profile. On Atlas, the Query Profiler and Performance Advisor show slow operations and suggest indexes.
It shows only results. The work is in totalKeysExamined and totalDocsExamined; a query returning 10 documents can still examine millions.
MongoDB used the index to find matching entries, then read the full documents, either to apply conditions the index can't check or to return fields not in the index.