MongoDB Performance Tuning and Monitoring
On this page
Symptom: everything got a bit slower
No single query is broken, but p99 latency across the application doubled over a month. That pattern rarely means one bad query. It usually means the database is running out of something: memory for the working set, disk throughput, connections or replication headroom. Monitoring tells you which.
MongoDB metrics to monitor
| Metric | Source | Healthy | Meaning when not |
|---|---|---|---|
| Operation latency (reads, writes) | serverStatus().opLatencies, Atlas charts | Stable | Rising: contention, cache misses or slow queries |
| Replication lag | rs.printSecondaryReplicationInfo() | Seconds | Growing: secondaries can't keep up; stale reads, slower majority writes |
| WiredTiger cache "dirty" and "used" | serverStatus().wiredTiger.cache | Used below ~80%, dirty below ~5% | High: working set doesn't fit, eviction pressure |
| Pages read into cache | Same | Low and stable | High: reads hitting disk |
| Connections | serverStatus().connections | Well under limits | Near limit: pool sizes too large or leaks |
| Queued operations / tickets | serverStatus | Near zero | Operations waiting for storage engine capacity |
| Slow queries | Logs, profiler | Few | Missing indexes or bad plans (Day 13) |
| Disk and CPU | Host metrics | Headroom | Saturation |
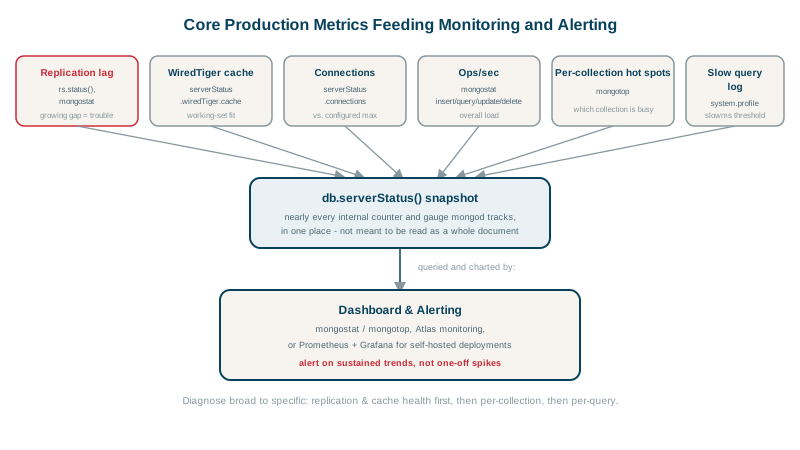
Quick views: mongostat (operations per second, cache use, queues, one line per second) and mongotop (time spent per collection). In Atlas, the Real-Time Performance Panel, metrics charts, Query Profiler and Performance Advisor show the same with history.
The working set and the WiredTiger cache
MongoDB's storage engine, WiredTiger, keeps recently used data and indexes in its cache, by default about half of RAM minus 1 GB. The working set, the data and indexes your application touches regularly, should fit in it. When it doesn't, reads go to disk and latency jumps. Signs: high "pages read into cache", rising latency without query changes. Fixes: more RAM, removing unused indexes, archiving cold data, covered queries and projections, or sharding.
MongoDB performance tuning checklist
- Queries and indexes. Fix the slow queries (Day 13), apply ESR (Day 8), remove unused and redundant indexes (
$indexStats). - Schema. Unbounded arrays, huge documents and hot single documents cause much "database" slowness (Days 4 and 17).
- Working set versus RAM. Make it fit.
- Write concern and replication. Lagging secondaries slow
majoritywrites; check secondary hardware and network. - Connections. Each connection uses memory. Create one client per application process and reuse it: in .NET that's a single
MongoClient(registered as a singleton), which holds the pool. A new client per request opens and tears down connections constantly. With many app instances, set driver pool sizes (maxPoolSize) deliberately, so instances × pool stays within what the server handles. - Hardware and storage. Fast SSDs with enough IOPS, and the XFS filesystem on Linux, as MongoDB recommends.
- Then scale: read preferences for analytics, a bigger instance, or sharding.
MongoDB alerts to set
- Replication lag above your tolerance (for example 30 seconds).
- No primary, or members unhealthy.
- Cache used above ~90% or dirty above ~20% (eviction pressure).
- Connection count near the limit.
- Disk space below 20% free; disk latency rising.
- Spikes in slow operations.
Check yourself
The working set no longer fits in the WiredTiger cache, so reads go to disk. Add RAM, trim indexes and cold data, or shard.
With w: "majority", a write is acknowledged only after a majority of members have applied it. If secondaries lag, that acknowledgment waits for them, so write latency rises even though the primary itself is fine.
Up to 8,000 connections, using a lot of server memory and possibly exceeding limits; size pools to the real concurrency each instance needs.
Replication lag, connection count near limits, cache dirty and used percentages, disk space, operation latency percentiles, and spikes in queued operations or slow queries.
The data and indexes the application touches regularly. It should fit in the WiredTiger cache; when it doesn't, reads go to disk and latency rises.