Build a Real-Time Data Pipeline with Kafka
On this page
The problem: a real-time page view pipeline
Product wants a live dashboard of views per page per minute, available within seconds, and the raw events kept for later analysis. 20,000 page-view events per second at peak, from web and mobile clients. Design and build the pipeline. Try the design yourself before reading on.
Ingestion, processing and delivery
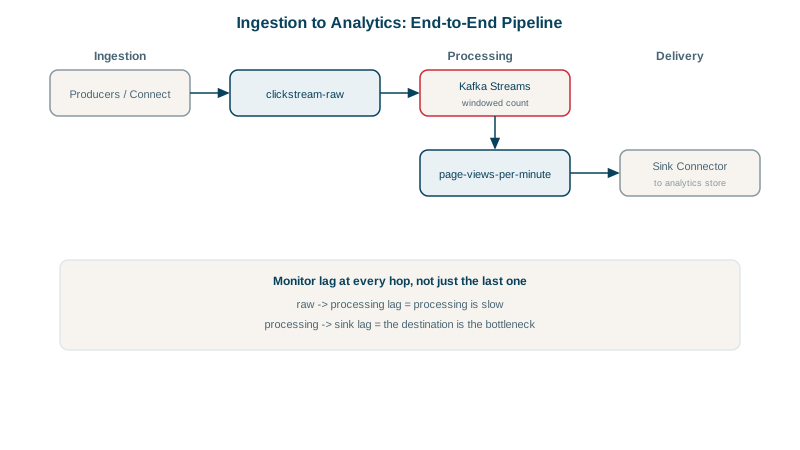
1. Ingestion. Browsers and apps shouldn't talk to Kafka directly. A small collector HTTP service validates events, adds server-side fields (received time, geo from IP) and produces to page-views:
- Key:
session_id, so each session's events stay in order for later sessionization (Days 14 and 17). - Schema: Avro in the schema registry with
BACKWARDcompatibility (Day 8), so the app team can't break downstream jobs with a field rename. - Producer:
acks=all, idempotence,linger.msaround 20 and compression (Day 5). - Sizing: 20,000 events/s at roughly 1 KB is 20 MB/s; with replication factor 3, that's 60 MB/s of broker writes. 24 partitions leaves room for consumer parallelism and growth (Day 22).
2. Processing. A Kafka Streams app (Days 15 to 17):
StreamsBuilder b = new StreamsBuilder();
b.stream("page-views", Consumed.with(Serdes.String(), pageViewSerde))
 .filter((session, v) -> !v.isBot())                                   // stateless cleanup
 .selectKey((session, v) -> v.pagePath())                              // re-key by page: repartitions
 .groupByKey(Grouped.with(Serdes.String(), pageViewSerde))
 .windowedBy(TimeWindows.ofSizeAndGrace(Duration.ofMinutes(1), Duration.ofSeconds(30)))
 .count(Materialized.as("views-per-page-minute"))
 .toStream((w, count) -> w.key() + "|" + w.window().startTime())
 .to("page-views-per-minute", Produced.with(Serdes.String(), Serdes.Long()));
Event-time windows with a 30-second grace period handle mobile clients that send late. exactly_once_v2 keeps counts correct across restarts. Standby replicas (Day 16) keep failover fast.
3. Delivery. Kafka Connect sinks (Day 12):
page-views-per-minute→ a serving store the dashboard queries: PostgreSQL or Redis via a JDBC/Redis sink with upserts onpage|minute, or a real-time analytics database such as ClickHouse or Apache Pinot, which can also ingest from Kafka directly.- Raw
page-views→ object storage (S3 sink, in Parquet), partitioned by date, for the data lake (System Design Roadmap, Day 29).
Upserts make the sink idempotent: a repeated count update for the same window simply overwrites.
Monitoring the pipeline
- Lag per consumer group (Day 23): the Streams app and each sink. Growing lag means the dashboard is falling behind.
- Dropped late records metric from the windowed count: rising means the grace period is too short for real client behavior.
- Dead-letter topic for events failing schema validation in the collector, with an alert on its rate.
- End-to-end latency: event time to arrival in the serving store, as the real SLO.
What a strong streaming pipeline design includes
- A collector in front of Kafka, not clients producing directly.
- Keys chosen per stage, and awareness that re-keying repartitions.
- Schemas with compatibility checks across every hop.
- Event-time windows with a measured grace period.
- Idempotent sinks, and raw data kept for replay.
- Lag and latency monitoring with alerts.
Check yourself
Browsers shouldn't talk to Kafka directly: the collector authenticates and rate-limits clients, validates and enriches events, keeps Kafka's brokers off the public internet, and produces to Kafka efficiently in batches with proper keys.
No. Late events that arrive within the grace period still belong to that minute, so the window's count is updated and the sink upserts the new value. If the business wants only final numbers, emit results after the grace period with suppress.
Aggregates only answer the questions you asked when you built them. Keeping the raw events in cheap object storage lets you answer new questions, fix a bug and recompute, or backfill a new metric over the full history, independent of Kafka's retention.
Ingestion rate and errors at the collector, consumer lag in time for each processing stage, dropped and late records, sink write errors and the freshness of the final data. An end-to-end freshness check, the age of the newest data in the dashboard, catches problems anywhere.