Kafka Monitoring: Key Metrics and Consumer Lag
On this page
Symptom: "the dashboard is ten minutes behind"
Nobody noticed until a product manager asked why yesterday's launch shows no traffic. The consumer group feeding the dashboard had been falling behind for two hours. Every metric needed to catch it existed; nobody was alerting on it.
Kafka broker metrics to monitor
Kafka exposes metrics over JMX; most teams scrape them into Prometheus with the JMX exporter (or use a managed service's metrics).
| Metric | Healthy | Meaning when not |
|---|---|---|
Under-replicated partitions (kafka.server:type=ReplicaManager,name=UnderReplicatedPartitions) | 0 | A replica is behind: broker down, overloaded disk or network (Day 24) |
Offline partitions (kafka.controller:type=KafkaController,name=OfflinePartitionsCount) | 0 | No leader: data unavailable. Page immediately |
| Active controller count | Exactly 1 across the cluster | 0 means no controller; more than 1 means trouble |
| Under-min-ISR partitions | 0 | acks=all writes to these partitions are failing |
| Request latency p99 (Produce, Fetch) | Stable | Rising means saturation |
| Request handler and network processor idle ratio | Well above 0.3 | Brokers running out of threads |
| Disk usage per broker | Below ~75% | A full disk takes the broker offline |
Plus the usual host metrics: CPU, disk I/O, network throughput.
Producer and consumer metrics
- Producer: record error rate, retry rate, request latency, and buffer available bytes (low means the producer can't send fast enough and
produce()will block). - Consumer: lag (
records-lag-max), fetch rate, commit failures, and rebalance rate (frequent rebalances, Day 11, waste throughput).
How to read consumer lag
bin/kafka-consumer-groups.sh --bootstrap-server kafka:9092 --describe --group dashboardGROUP TOPIC PARTITION CURRENT-OFFSET LOG-END-OFFSET LAG
dashboard page-views 0 8810230 8810311 81
dashboard page-views 1 8790115 8790176 61
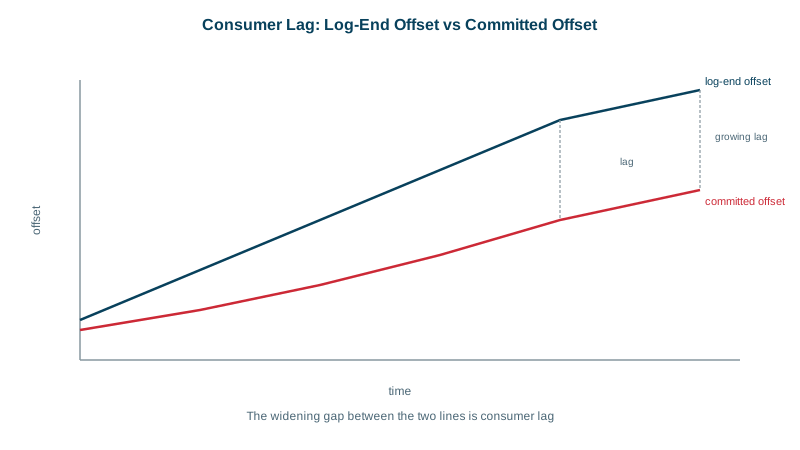
dashboard page-views 2 7120040 8805992 1685952Partitions 0 and 1 are fine. Partition 2 is far behind: one stuck consumer, a slow downstream for that partition, or a hot key (Day 14). Lag on every partition growing together means the whole group is too slow.
Consumer lag in time, not records
"1.6 million records behind" means very different things for a topic receiving 100 records a second and one receiving 100,000. Convert lag into time: how old is the oldest unprocessed record, or how long would it take to catch up at the current rate? Tools such as Burrow, Kafka Lag Exporter-style exporters, KEDA and most managed Kafka services report time-based lag or lag trends. Alert on time lag against what the consumer's users need: "the dashboard is more than 2 minutes behind" is a meaningful alert; "lag above 10,000" usually isn't.
Kafka alerts worth setting
| Alert | Severity |
|---|---|
| Offline partitions > 0 | Page |
| Active controllers != 1 | Page |
| Under-min-ISR partitions > 0 | Page (writes failing) |
| Under-replicated partitions > 0 for 5+ minutes | Warning, page if growing |
| Consumer time lag above the consumer's SLO | Page for critical consumers |
| Broker disk > 75% | Warning, > 85% page |
| Producer error rate rising | Warning |
Base thresholds on each topic's and group's normal behavior; a nightly batch job has very different "normal lag" from a payment consumer.
Check yourself
Most often a hot key that sends far more traffic to that partition, a consumer instance that's stuck, slow or repeatedly rebalancing, or records on that partition that are unusually expensive to process, such as a poison message being retried. Check per-partition bytes in and the assigned consumer's logs.
A lag of 10,000 records is seconds behind on a busy topic and hours behind on a quiet one, so record counts don't tell you how stale the data is. Time lag, how old the oldest unprocessed record is, maps directly to what users notice and to your freshness targets.
OfflinePartitionsCount above zero. An offline partition has no leader, so nothing can be written to or read from it, which means a real outage for every producer and consumer using it.
Some followers aren't keeping up with their leaders, because of a failed broker, overloaded disks or network, or heavy reassignment traffic. Durability is reduced while it lasts, so investigate quickly even though data still flows.