AI Agent Observability and Cost: OpenTelemetry
On this page
Learning Objective
Instrument an agent so you can answer what it did, why, how long it took and what it cost: trace model and tool calls with OpenTelemetry, account for tokens including cache reads, attribute cost per task, and apply the main levers for reducing cost and latency.
Concept Explanation
An agent in production is a distributed system whose control flow is decided at run time by a model. When a user reports a bad answer, you need the full trajectory: every model call with its inputs and outputs, every tool call with arguments, results and errors, and the timing of each. Logs scattered across services are not enough; you need a trace that ties one task together.
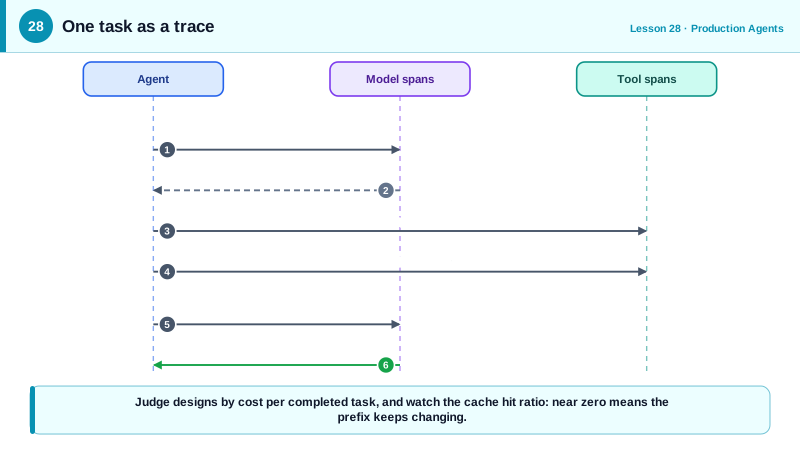
Distributed tracing fits naturally. A task is a trace; each model call and each tool call is a span within it, with attributes such as model name, token counts, tool name, error status and latency. OpenTelemetry's generative AI semantic conventions define standard attribute names such as gen_ai.request.model and gen_ai.usage.input_tokens, so traces from different frameworks look alike in tools such as Jaeger, Honeycomb, Datadog or LLM-specific platforms such as Langfuse and LangSmith. MCP reserves the traceparent key in request metadata, so a trace can continue from the agent into an MCP server and on into the databases it queries.
Cost needs its own accounting because agents resend the conversation on every step. The Claude API reports usage per response: input tokens, output tokens, and tokens written to and read from the prompt cache. Cache reads are billed at about a tenth of the normal input price, and caching is the single largest cost lever for agents, because the system prompt, tool definitions and earlier turns form a stable prefix that is reused every step. Keep that prefix stable: no timestamps in the system prompt, a deterministic tool order, and append-only history. Watch cache_read_input_tokens; if it stays at zero, something is invalidating the cache.
Measure cost per completed task, not per request. A cheaper model that needs twice the steps or fails more often is not cheaper. Other levers, roughly in order of how often they help, are trimming tool results, lowering the effort setting for simple routes, routing easy requests to smaller models, batching non-interactive work at half price, and capping steps and budgets so runaway loops stop early.
Latency has its own levers. Run independent tool calls in parallel. Stream output so users see progress. Use fast models for classification and routing steps. Report progress for long tool calls. And watch the tail: the slowest five percent of tasks often come from loops or slow tools that a trace makes obvious.
| Signal | Source | Use |
|---|---|---|
| Trace per task, span per model or tool call | OpenTelemetry instrumentation | Debug a specific bad run end to end |
| input, output, cache write and cache read tokens | usage on each API response | Cost per step and cache health |
| Cost per completed task | Token counts times prices, divided by successes | Compare designs honestly |
| Steps per task | Count of model calls | Detect loops and inefficiency |
| Tool latency and error rate | Tool spans | Find slow or failing tools |
| Cache hit ratio | cache reads over total input | Spot prompt prefix instability |
Worked Example: Tracing and Costing Each Model Call
This wrapper creates an OpenTelemetry span for every model call with standard generative AI attributes, and accumulates cost from the usage block. Prices are per million tokens for Claude Opus 5.5 in October 2026; keep them in configuration, not code.
from opentelemetry import trace

tracer = trace.get_tracer("support-agent")
PRICE = {"input": 4.00, "output": 20.00, "cache_write": 5.00, "cache_read": 0.20}   # USD per 1M

class CostMeter:
    def __init__(self):
        self.usd = 0.0
        self.cache_read = self.input_total = 0

    def add(self, usage) -> float:
        cw = usage.cache_creation_input_tokens or 0
        cr = usage.cache_read_input_tokens or 0
        cost = (usage.input_tokens * PRICE["input"] + usage.output_tokens * PRICE["output"]
                + cw * PRICE["cache_write"] + cr * PRICE["cache_read"]) / 1_000_000
        self.usd += cost
        self.cache_read += cr
        self.input_total += usage.input_tokens + cw + cr
        return cost

def traced_call(client, meter: CostMeter, **request):
    with tracer.start_as_current_span("chat " + request["model"]) as span:
        span.set_attribute("gen_ai.operation.name", "chat")
        span.set_attribute("gen_ai.request.model", request["model"])
        response = client.messages.create(**request)
        u = response.usage
        span.set_attribute("gen_ai.usage.input_tokens", u.input_tokens)
        span.set_attribute("gen_ai.usage.output_tokens", u.output_tokens)
        span.set_attribute("gen_ai.response.finish_reasons", [response.stop_reason])
        span.set_attribute("app.cost_usd", meter.add(u))
        return response

# After a task: log meter.usd and meter.cache_read / meter.input_total (the cache hit ratio).
# A ratio near zero on a 20-step task means the prompt prefix is changing between calls.
Wrap tool calls the same way with an execute_tool span carrying the tool name. In a trace viewer, one task then reads as a timeline: model call, three parallel tool spans, model call, final answer, with cost on every model span.
Real-World Examples
- OpenTelemetry's generative AI semantic conventions define attributes such as gen_ai.request.model and gen_ai.usage.input_tokens, and are supported by vendors including Datadog, Honeycomb and Grafana as well as LLM observability tools such as Langfuse.
- Anthropic's prompt caching documentation prices cache reads at a small fraction of base input cost, which is why long-running coding agents such as Claude Code are designed to keep a stable, append-only prompt prefix and achieve high cache hit rates.
Review Questions & Answers
A trace ties every model call and tool call of one task together in order, with timing, inputs, outputs and errors, so you can follow the exact trajectory that led to a bad result.
Agents resend the system prompt, tools and history on every step. If that prefix is stable it is served from cache at a fraction of the input price, which cuts cost and latency across many steps.
Something is changing the prompt prefix between calls, such as a timestamp in the system prompt, a tool list in a different order, or history being rewritten, so the cache is invalidated every time.
A design with cheaper requests may need more steps or fail more often. Only cost per successful task shows which design is actually cheaper for the outcome you need.