Network Troubleshooting: ping, traceroute, dig, tcpdump
On this page
Symptom: "the site is intermittently slow"
A report comes in: the site is sometimes slow, sometimes fine. Guessing wastes hours. Work through the layers with a tool for each (Day 2), and let the results decide where to look next.
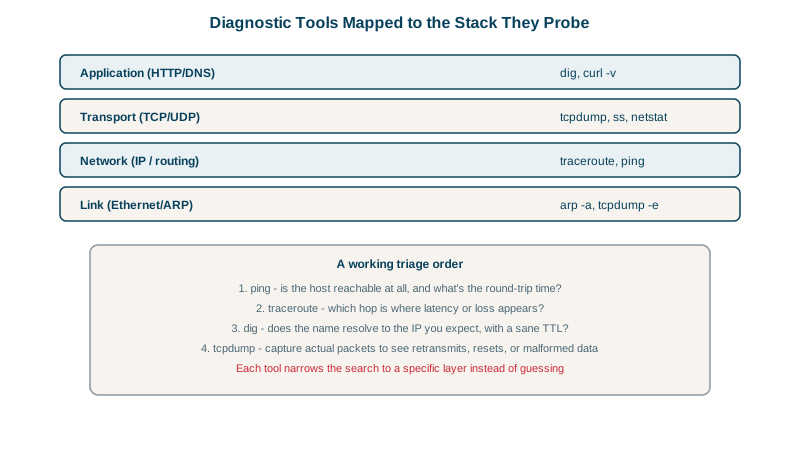
1. ping: is it reachable, and how stable is it?
ping -c 10 -q 8.8.8.8round-trip min/avg/max/stddev = 16.691/54.197/238.902/70.927 msA real result from a home connection, and it already tells a story. The minimum of 17 ms shows the path's real distance; a maximum of 239 ms and a standard deviation of 71 ms show heavy jitter. Something on the path, often Wi-Fi or a saturated home link, is adding delay some of the time. Look at loss too: any steady loss above zero hurts TCP badly (Day 9).
Remember that some hosts block ICMP, so a failing ping doesn't prove a host is down.
2. traceroute: where does it go wrong?
traceroute -n -q 1 -w 1 1.1.1.1Look for the first hop where latency jumps and stays high to the end, or where replies stop entirely (Day 5). A jump at hop 1 or 2 points at your own network; a jump in the middle at a provider or a long-distance link. mtr combines ping and traceroute, measuring loss and latency per hop over time, which is much better for intermittent problems.
3. dig: is DNS right and fast?
dig +noall +answer +stats example.com A
dig @1.1.1.1 +short example.com Aexample.com. 203 IN A 104.20.23.154
example.com. 203 IN A 172.66.147.243
;; Query time: 21 msecCheck three things: the answer is the address you expect, it matches what the authoritative server says (Day 12), and the query time is small. Slow or failing lookups at one resolver but not another point at that resolver. For the full picture of a request, curl -w with timing variables (Day 1) splits DNS, connect, TLS and server time in one go.
4. tcpdump: what's really on the wire?
When the higher-level tools disagree or show nothing, capture packets:
sudo tcpdump -i en0 -nn host example.com and port 443 -w capture.pcapThen open the file in Wireshark. What to look for:
- Retransmissions and duplicate acknowledgments: packet loss.
- SYNs with no SYN-ACK: a firewall dropping the connection.
- RST packets: something actively refusing or resetting connections.
- Long gaps between the request and the first response bytes: the server is slow, not the network.
- TLS alerts right after the ClientHello: protocol or certificate mismatches.
Capture on both client and server if you can; comparing the two shows where packets disappear. Captures can contain sensitive data, so store them carefully.
A network troubleshooting triage order
- Reproduce and time it:
curl -wtiming. Which stage is slow: DNS, connect, TLS or first byte? - First byte slow? It's the server. Check application metrics and logs, not the network.
- Connect slow or failing? ping and mtr for loss and latency; check firewalls and security groups for drops.
- DNS slow or wrong? dig against several resolvers and the authoritative server.
- Still unclear? tcpdump on both ends.
On servers, ss -tan (Linux) or netstat -an shows connection states (Day 8), and nc -zv host port tests a single port quickly.
Check yourself
High jitter: the path itself is short, as the minimum shows, but something intermittently adds delay, such as congestion, Wi-Fi interference, a saturated link or bufferbloat. Look for a pattern in when the spikes happen.
None of the network tools: connecting took 20 ms, so the network is fine. The three seconds were spent on the server, so look at application metrics, logs, traces and slow queries.
The connection attempts aren't answered, most likely a firewall or security group silently dropping them, or the host or route is down. Check the rules along the path and whether the server sees the SYNs with its own capture.
DNS first, then reachability with ping, then the path with traceroute or mtr, then the port with curl or nc, and finally packet capture with tcpdump when the problem is still unclear.
It runs continuously and shows loss and latency per hop over many samples, which exposes intermittent problems a single traceroute misses.