Monitoring and Observability for DevOps
On this page
Why observability is part of delivery
Deploying ten times a day multiplies the chances of a bad change. The counterweight is knowing, within minutes, that something got worse and which deploy did it. Monitoring is part of the delivery pipeline, not something bolted on afterwards.
Monitoring vs observability
- Monitoring answers questions you knew to ask: is the error rate above 1 percent? Is the disk 90 percent full?
- Observability lets you ask new questions about behavior you didn't predict: why are requests from one customer on one endpoint slow since 14:02? It comes from rich, correlated telemetry.
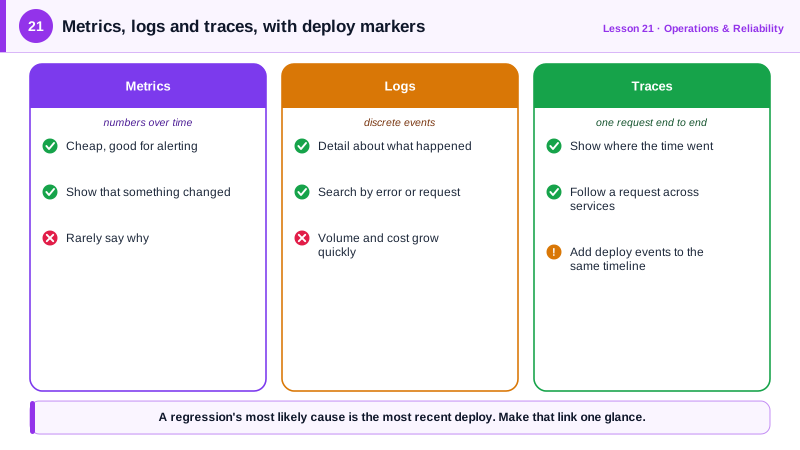
Three kinds of telemetry, ideally connected by a shared trace ID:
| Signal | What it tells you | Examples |
|---|---|---|
| Metrics | Numbers over time; cheap, good for alerts and trends | Request rate, error rate, latency percentiles, CPU |
| Logs | Detailed records of individual events | Structured JSON logs with request ID, user, error |
| Traces | One request's path across services, with timings | A checkout spanning API, payment and inventory services |
OpenTelemetry is the vendor-neutral standard for producing all three; send them to Prometheus and Grafana, Datadog, Honeycomb, New Relic, CloudWatch or others without re-instrumenting.
Golden signals, SLOs and error budgets
For each service, the golden signals (from Google's SRE book):
- Latency: how long requests take, as percentiles (p50, p95, p99), separately for successes and errors.
- Traffic: requests per second.
- Errors: the rate of failed requests.
- Saturation: how full the system is (CPU, memory, connection pools, queue depth).
Turn the most important ones into SLOs (service level objectives): "99.9 percent of checkout requests succeed in under 500 ms over 30 days". The remaining 0.1 percent is the error budget. Burning it quickly means slow down and fix reliability; plenty left means you can take more risk. Alert on burn rate, not on every blip.
To make that concrete: over 30 days, 99.9 percent allows about 43 minutes of complete outage, or, for a service handling 10 million requests in that time, 10,000 failed ones. The burn rate says how fast you're spending that allowance. A burn rate of 1 spends it exactly over the 30 days. A burn rate of 14.4 spends 2 percent of the month's budget in a single hour and would use it all up in about two days, which is the classic threshold for paging someone right away.
Marking deploys on dashboards
The most useful single habit: record each deploy on the same timeline as your metrics. A spike that starts right after a deploy marker needs no further investigation to find the suspect. With Grafana's annotations API, the deploy job adds one step:
curl -sf -X POST "https://grafana.example.com/api/annotations" \
  -H "Authorization: Bearer $GRAFANA_TOKEN" \
  -H "Content-Type: application/json" \
  -d "{\"time\": $(date +%s000), \"tags\": [\"deploy\", \"checkout-svc\"],
       \"text\": \"checkout-svc ${GITHUB_SHA::12} deployed by ${GITHUB_ACTOR}\"}"
Datadog events, Honeycomb markers and New Relic change tracking do the same. Also expose the running version (a /version endpoint or a version label on metrics), so you can compare old and new versions side by side during a canary.
Monitoring that triggers rollbacks
- Canary analysis (Day 14) queries the error rate and latency of the new version and aborts automatically.
- Deployment alarms trigger automatic rollback (CodeDeploy, Argo Rollouts, Flagger).
- Alerts route to the owning team, with a link to a dashboard and a runbook (Day 22).
Alerting well
- Alert on symptoms users feel (errors, latency, SLO burn), not on every cause (CPU at 80 percent). Put causes on dashboards.
- Every page must be actionable and need a human now. Anything else is a ticket or a dashboard.
- Review noisy alerts regularly; alert fatigue makes people miss the real ones.
Check yourself
Latency, traffic, errors and saturation. Latency is how long requests take, traffic how many arrive, errors how many fail, and saturation how close resources are to their limits. Together they show most user-facing problems.
A regression that starts right after a deploy marker points straight at the likely cause, cutting investigation from an hour to minutes, and makes it easy to decide on a rollback.
It's the allowed unreliability under an SLO; when it's being used up fast, the team slows releases and prioritizes reliability work.
10,000 failures. A burn rate of 1 means failures are arriving at exactly the pace that would use up those 10,000 by the end of the 30 days.