DORA Metrics Explained
On this page
What DORA metrics are
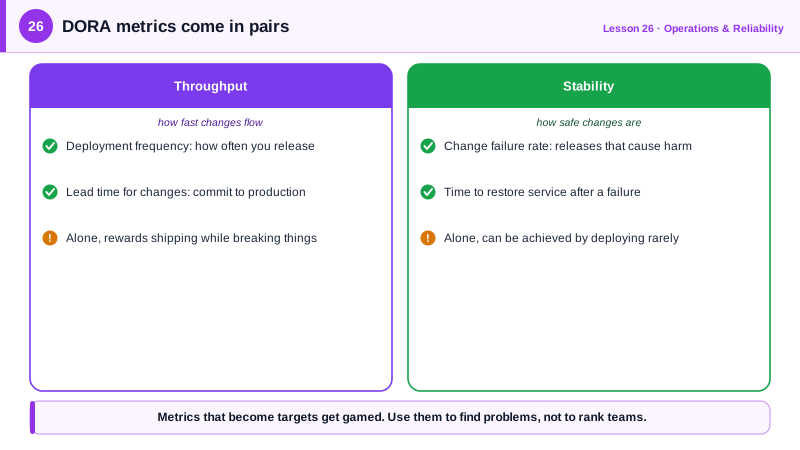
"We've adopted DevOps" isn't measurable. The DORA research program (DevOps Research and Assessment, now part of Google Cloud) studied thousands of teams over a decade and found a small set of metrics that predict both delivery performance and organizational outcomes. Its key finding: speed and stability go together. The best teams deploy more often and fail less.
The four DORA metrics
| Metric | Measures | Question it answers |
|---|---|---|
| Deployment frequency | Throughput | How often do we deploy to production? |
| Lead time for changes | Throughput | How long from commit to running in production? |
| Change failure rate | Stability | What share of deployments cause a failure needing remediation? |
| Failed deployment recovery time | Stability | How quickly do we recover when a deployment fails? (Formerly "time to restore service".) |
Recent DORA reports add a fifth, rework rate: the share of deployments that are unplanned fixes for user-facing problems.
Computing DORA metrics from deploy records
A month of deployments, each with its first commit time, deploy time and whether it caused a failure, plus the recovery times:
# dora.py: the four DORA metrics from a month of deploy and incident records
from datetime import datetime as dt
from statistics import median

deploys = [  # (first commit time, deployed at, caused a failure in production?)
    ("2026-09-01 09:10", "2026-09-01 15:40", False), ("2026-09-02 11:00", "2026-09-03 10:05", False),
    ("2026-09-04 08:30", "2026-09-04 13:15", True),  ("2026-09-08 10:00", "2026-09-08 16:20", False),
    # ... 8 more deploys through September ...
]
restores = [("2026-09-04 13:20", "2026-09-04 13:52"), ("2026-09-17 17:50", "2026-09-17 19:05")]

t = lambda s: dt.strptime(s, "%Y-%m-%d %H:%M")
hours = lambda a, b: (t(b) - t(a)).total_seconds() / 3600
working_days = 22

print(f"Deployment frequency:  {len(deploys) / working_days:.2f} per working day")
print(f"Lead time for changes: median {median(hours(c, d) for c, d, _ in deploys):.1f} hours")
print(f"Change failure rate:   {sum(f for *_, f in deploys) / len(deploys):.0%}")
print(f"Time to restore:       median {median(hours(a, b) * 60 for a, b in restores):.0f} minutes")
With all 12 September deploys:
Deployment frequency:  0.55 per working day (12 in September)
Lead time for changes: median 5.9 hours, commit to production
Change failure rate:   17%
Time to restore:       median 54 minutes
Reading it: deploys happen about every other day; changes reach production within a working day; 2 of 12 deploys failed (17 percent); recovery takes under an hour. To improve throughput, look at what limits deploys to every other day. To improve stability, look at the two failures' postmortems.
In practice, collect these automatically from your CI/CD system and incident tool (Four Keys, Sleuth, LinearB, or your platform's built-in reports) rather than by hand.
Using DORA metrics well
- Medians, not averages: one week-long change shouldn't dominate lead time.
- Track trends for one team over time. Comparing teams with different products, risk and architectures is misleading.
- Never use them as targets for individuals. Goodhart's law applies: if deployment frequency is the goal, people split changes artificially or redefine "deploy". DORA's own guidance is to use the metrics for learning, not ranking.
- Look at all four together. Higher frequency with a rising failure rate isn't progress.
- Pair with the capabilities that drive them: small batches, trunk-based development, test automation, loosely coupled architecture, and a healthy culture (Days 2, 6 and 27).
Check yourself
Deployment frequency and lead time for changes measure throughput, how fast changes flow. Change failure rate and time to restore service measure stability. High performers do well on both.
Not overall. Throughput rose but stability fell sharply, so users likely see more problems. The four metrics have to be read together; improving one at the cost of another isn't progress.
Teams differ in context, such as legacy systems or regulation, so comparisons mislead. Turning metrics into targets invites gaming, like splitting deploys, which destroys their value for learning.
From commit to running in production, using timestamps from version control and deployment records. Starting from ticket creation mixes in planning time, which DORA measures separately.
Find the team's biggest bottleneck, such as slow reviews or manual testing, fix it, and watch whether the metrics improve.