Docker Logs and Debugging Containers
On this page
Debugging a container stuck in a restart loop
docker ps shows Restarting (1) 3 seconds ago. There's no log file in the container, you can't exec into it because it's never up long enough, and the image has no shell anyway. A short, ordered routine finds the cause almost every time.
Log to stdout, not files, and rotate Docker logs
The container convention is simple: write logs to standard output and standard error. Docker captures both, docker logs shows them, and any log collector (Day 26 for Kubernetes) picks them up the same way. Log files inside a container are lost when it's removed, fill its writable layer, and are invisible to tools.
Many official images already redirect their files to stdout; nginx's image, for example, links its access and error logs to /dev/stdout and /dev/stderr. Use structured JSON logs where you can.
By default Docker stores logs in JSON files on the host with no size limit, which can fill a disk. Set rotation:
// /etc/docker/daemon.json
{ "log-driver": "json-file", "log-opts": { "max-size": "10m", "max-file": "3" } }
Two details catch people. The change applies only to containers created after you restart Docker; existing containers keep unlimited logs until they're recreated. And Docker's documentation recommends the local driver, which rotates by default, over json-file (Docker docs).
A step-by-step container debugging routine
docker ps -a                                    # status, exit code, restart count
docker logs --tail 100 api                      # last output, works on stopped containers too
docker logs -f --since 10m api                  # follow recent output
docker inspect api --format '{{json .State}}'   # ExitCode, OOMKilled, Error, health
docker events --since 15m --filter container=api   # start, die, oom, health_status events
docker stats api                                # live CPU, memory, network
docker exec -it api sh                          # look inside a running container
Work through them in that order:
- Logs usually say what went wrong: a missing environment variable, a connection refused, an unhandled exception.
- State from
inspect: exit code (Day 5),OOMKilled: truemeans raise the memory limit or fix a leak. - Configuration from
inspect: environment, mounts, ports, command. Is it what you think it is? - Inside, if it stays up: are files where expected, can it resolve and reach its dependencies?
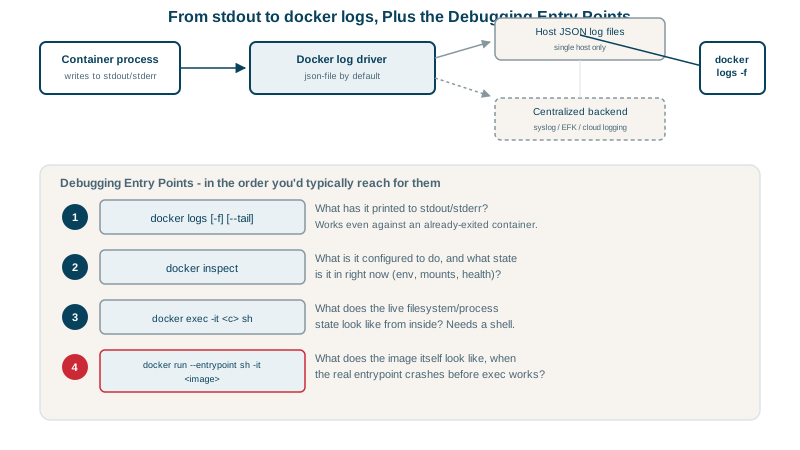
Debugging containers that exit fast or have no shell
Override the entry point to keep it alive and look around:
docker run --rm -it --entrypoint sh myorg/api:1.4.0Then run the real command by hand and watch it fail.
No shell (distroless images): run a debug container that joins the target's namespaces:
docker run --rm -it --pid container:api --network container:api nicolaka/netshootFrom there you can see its processes and test its network (DNS, curl, tcpdump) with a full toolkit, without adding tools to the production image. docker debug offers the same idea in recent Docker versions. Kubernetes has kubectl debug with ephemeral containers (Day 26).
Copy files out of a stopped container: docker cp api:/app/appsettings.json .
Common causes of container restart loops
| Clue | Likely cause |
|---|---|
| Exit code 1, error in logs | App configuration or startup error |
Exit code 137, OOMKilled: true | Memory limit too low or a leak |
| Exit code 127 | Command or binary not found in the image |
exec format error | Image built for another CPU architecture |
| Starts, then health check fails | App up but dependency unreachable, or wrong port |
Check yourself
Docker captures stdout and stderr automatically, so docker logs and log collectors work without extra setup. Files inside the container fill its writable layer, are invisible to log tooling, and disappear when the container is removed, exactly when you'd need them to investigate.
docker logs <container> to see what it printed before exiting, and docker inspect <container> for the exit code, the OOMKilled flag and its configuration. Together they usually tell you whether it's crashing on startup, running out of memory or failing because of bad config.
Start a debug container that shares the target's process and network namespaces, for example docker run -it --pid container:app --network container:app nicolaka/netshoot, or use docker debug. The debug container brings the tools, so the production image stays minimal.
By default the driver keeps container logs forever, so a chatty container can fill the host's disk. Set max-size and max-file in the daemon or per container, or use a driver that ships logs elsewhere.
"Command not found": the entrypoint or command doesn't exist in the image, often because of a typo, a missing binary in a slim image, or a shell script with Windows line endings.