Kubernetes Monitoring, Logging and Tracing
On this page
Why Kubernetes needs central observability
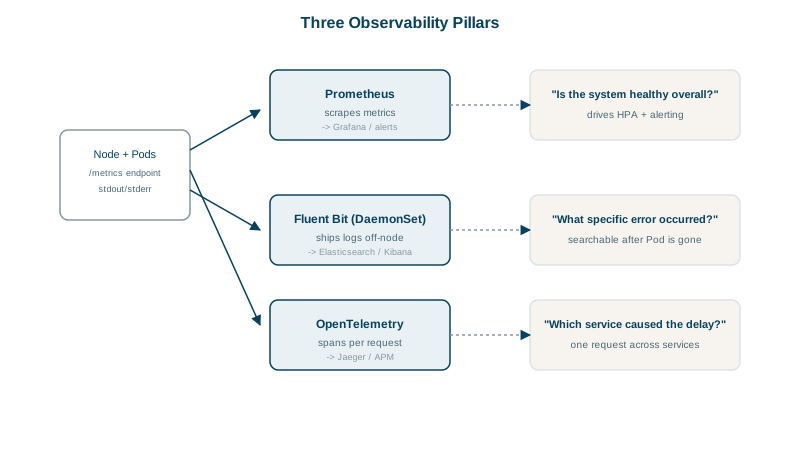
An error spike hit at 02:10. The Pods that served those requests were replaced by a rollout at 02:30, and their logs went with them. The request touched four services; which one was slow? On one host you'd use docker logs (Day 12). In a cluster you need data collected centrally, from every Pod, before it disappears.
Kubernetes metrics with Prometheus
Prometheus (Day 87 of the System Design Roadmap covers the model) is the standard. The kube-prometheus-stack Helm chart installs Prometheus, Alertmanager, Grafana and exporters:
- kube-state-metrics: the state of Kubernetes objects: desired versus available replicas, Pod restarts, Pending Pods.
- node-exporter: node CPU, memory, disk and network.
- cAdvisor (in the kubelet): per-container CPU, memory and throttling.
- Your apps expose
/metrics; aServiceMonitortells Prometheus to scrape them.
Alerts worth having from day one: Pods in CrashLoopBackOff, Deployments with fewer available replicas than desired, containers near memory limits or heavily CPU-throttled, nodes under disk or memory pressure, and your services' error rate and latency.
Both the scrape targets and the alerts are Kubernetes objects that the Prometheus Operator in kube-prometheus-stack watches. A ServiceMonitor selects Services by label and names the port to scrape; a PrometheusRule holds alerts written in PromQL:
apiVersion: monitoring.coreos.com/v1
kind: ServiceMonitor
metadata:
  name: orders-api
  namespace: checkout
  labels: { release: kube-prometheus-stack }   # the chart's default selector looks for its release label
spec:
  selector:
    matchLabels: { app: orders-api }
  endpoints:
    - port: http             # the Service port's name, not its number
      path: /metrics
      interval: 30s
---
apiVersion: monitoring.coreos.com/v1
kind: PrometheusRule
metadata:
  name: orders-api-alerts
  namespace: checkout
  labels: { release: kube-prometheus-stack }
spec:
  groups:
    - name: orders-api
      rules:
        - alert: PodCrashLooping
          expr: max by (namespace, pod) (kube_pod_container_status_waiting_reason{reason="CrashLoopBackOff", namespace="checkout"}) > 0
          for: 5m
          labels: { severity: critical }
          annotations:
            summary: "Pod {{ $labels.pod }} is crash looping"
Two things trip people up: the Service's port needs a name matching port: in the ServiceMonitor, and with the chart's defaults, monitors and rules without its release label are silently ignored.
Collecting Kubernetes logs with a node agent
Apps write to stdout (Day 12). The container runtime stores those on the node, and a log agent runs on every node as a DaemonSet to ship them centrally: Fluent Bit, Vector or the OpenTelemetry Collector, sending to Loki, Elasticsearch/OpenSearch or a cloud log service. The agent adds Kubernetes metadata (namespace, Pod, container, labels), so you can query "all errors from app=orders-api in checkout around 02:10" even after those Pods are gone.
Distributed tracing with OpenTelemetry
Instrument services with OpenTelemetry; send spans to an OpenTelemetry Collector running in the cluster, then to a tracing backend (Jaeger, Grafana Tempo or a commercial service). Traces show which service and which call made a request slow (Day 88 of the roadmap). Include the trace id in every log line to jump between them.
kubectl commands for live debugging
kubectl get pods -n checkout -o wide            # status, restarts, node
kubectl describe pod <pod> -n checkout          # events: scheduling, pulls, probes, OOM kills
kubectl logs <pod> -c api --previous            # logs of the last crashed instance
kubectl logs -l app=orders-api --since=15m      # recent logs from all matching Pods
kubectl top pods -n checkout                    # live CPU and memory (needs metrics-server)
kubectl get events -n checkout --sort-by=.lastTimestamp
kubectl debug -it <pod> --image=nicolaka/netshoot --target=api   # ephemeral debug container
kubectl debug adds a temporary container with tools into a running Pod, sharing its process namespace, which is how you debug distroless images without rebuilding them.
Debugging an incident with metrics, traces and logs
- Alert: checkout error rate above 2 percent (metrics).
- Dashboard: errors began at 02:08, only for
orders-apiversion 1.4.3, deployed at 02:05. - Trace: failing requests spend 5 seconds in a call from
orders-apito the inventory service, then time out. - Logs for those trace ids:
inventory: connection refused; the new version uses a wrong Service port. - Fix: roll back (
helm rollbackorkubectl rollout undo), then correct the config.
Each signal answered one question: metrics said that something was wrong, traces said where, logs said why.
Check yourself
When Pods are deleted or rescheduled, their logs on the node go with them; an agent stores them centrally with Kubernetes metadata for later search.
kube-state-metrics reports the state of Kubernetes objects from the API: desired versus available replicas, Pod phases, restart counts and job completions. cAdvisor, built into the kubelet, reports container resource usage such as CPU and memory. Alerts like "Deployment has unavailable replicas" need the first.
Use kubectl debug -it <pod> --image=busybox --target=<container>, which adds an ephemeral container with tools to the running Pod and shares the target container's process namespace. You can inspect its processes and network without changing the app's image.
That the Service's port has a name matching the ServiceMonitor's port, and that the ServiceMonitor carries the label your Prometheus selects on, such as the chart's release label.