Monitoring with Prometheus and Grafana Concepts
On this page
Logs answer "what happened"; metrics answer "is it OK?"
Searching logs is great for a specific request. It's a poor way to know whether the whole checkout service is healthy right now, because that needs counting millions of events continuously. Metrics are numeric measurements aggregated over time: requests per second, error count, latency distribution, queue depth. They're cheap to store and fast to query, which makes them the basis of dashboards and alerts.
How Prometheus works: the pull model
Prometheus is the open-source standard for metrics. Each service exposes its current metrics at an HTTP endpoint, usually /metrics, in a simple text format. Prometheus scrapes every target every 15 to 60 seconds and stores the time series. Targets are discovered automatically, for example from Kubernetes.
# HELP http_requests_total Total HTTP requests.
# TYPE http_requests_total counter
http_requests_total{service="checkout",method="POST",status="200"} 1027341
http_requests_total{service="checkout",method="POST",status="500"} 2214
Pulling has a useful side effect: if a target stops responding to scrapes, that itself is a signal (up == 0).
Prometheus metric types: counter, gauge, histogram, summary
- Counter: only goes up (requests served, errors). You look at its rate.
- Gauge: goes up and down (memory in use, queue depth, active connections).
- Histogram: counts observations in buckets (request durations), so you can compute percentiles across instances.
- Summary: precomputed percentiles per instance; can't be combined across instances, so histograms are usually preferred.
Labels add dimensions (service, endpoint, status). Keep their values bounded: a label containing user ids creates millions of time series and can overwhelm Prometheus. This is the cardinality problem. Raw URL paths are a sneaky version: /orders/10442 and /orders/10443 become separate series, so label with the route template, /orders/{id}, instead.
Histogram buckets decide what you can measure. A percentile is estimated from the bucket boundaries, so if your SLO is "under 500 ms" (Day 78), make sure 0.5 seconds is a bucket boundary. With buckets at 0.25 and 1 second, you can't tell 400 ms from 900 ms.
The four golden signals
From Google's SRE book, the minimum to watch for any user-facing service:
| Signal | Question | Example PromQL |
|---|---|---|
| Latency | How long do requests take? | histogram_quantile(0.99, sum by (le) (rate(http_request_duration_seconds_bucket[5m]))) |
| Traffic | How much demand? | sum(rate(http_requests_total[5m])) |
| Errors | What share fails? | sum(rate(http_requests_total{status=~"5.."}[5m])) / sum(rate(http_requests_total[5m])) |
| Saturation | How full is it? | CPU, memory, connection pool or queue depth as a share of capacity |
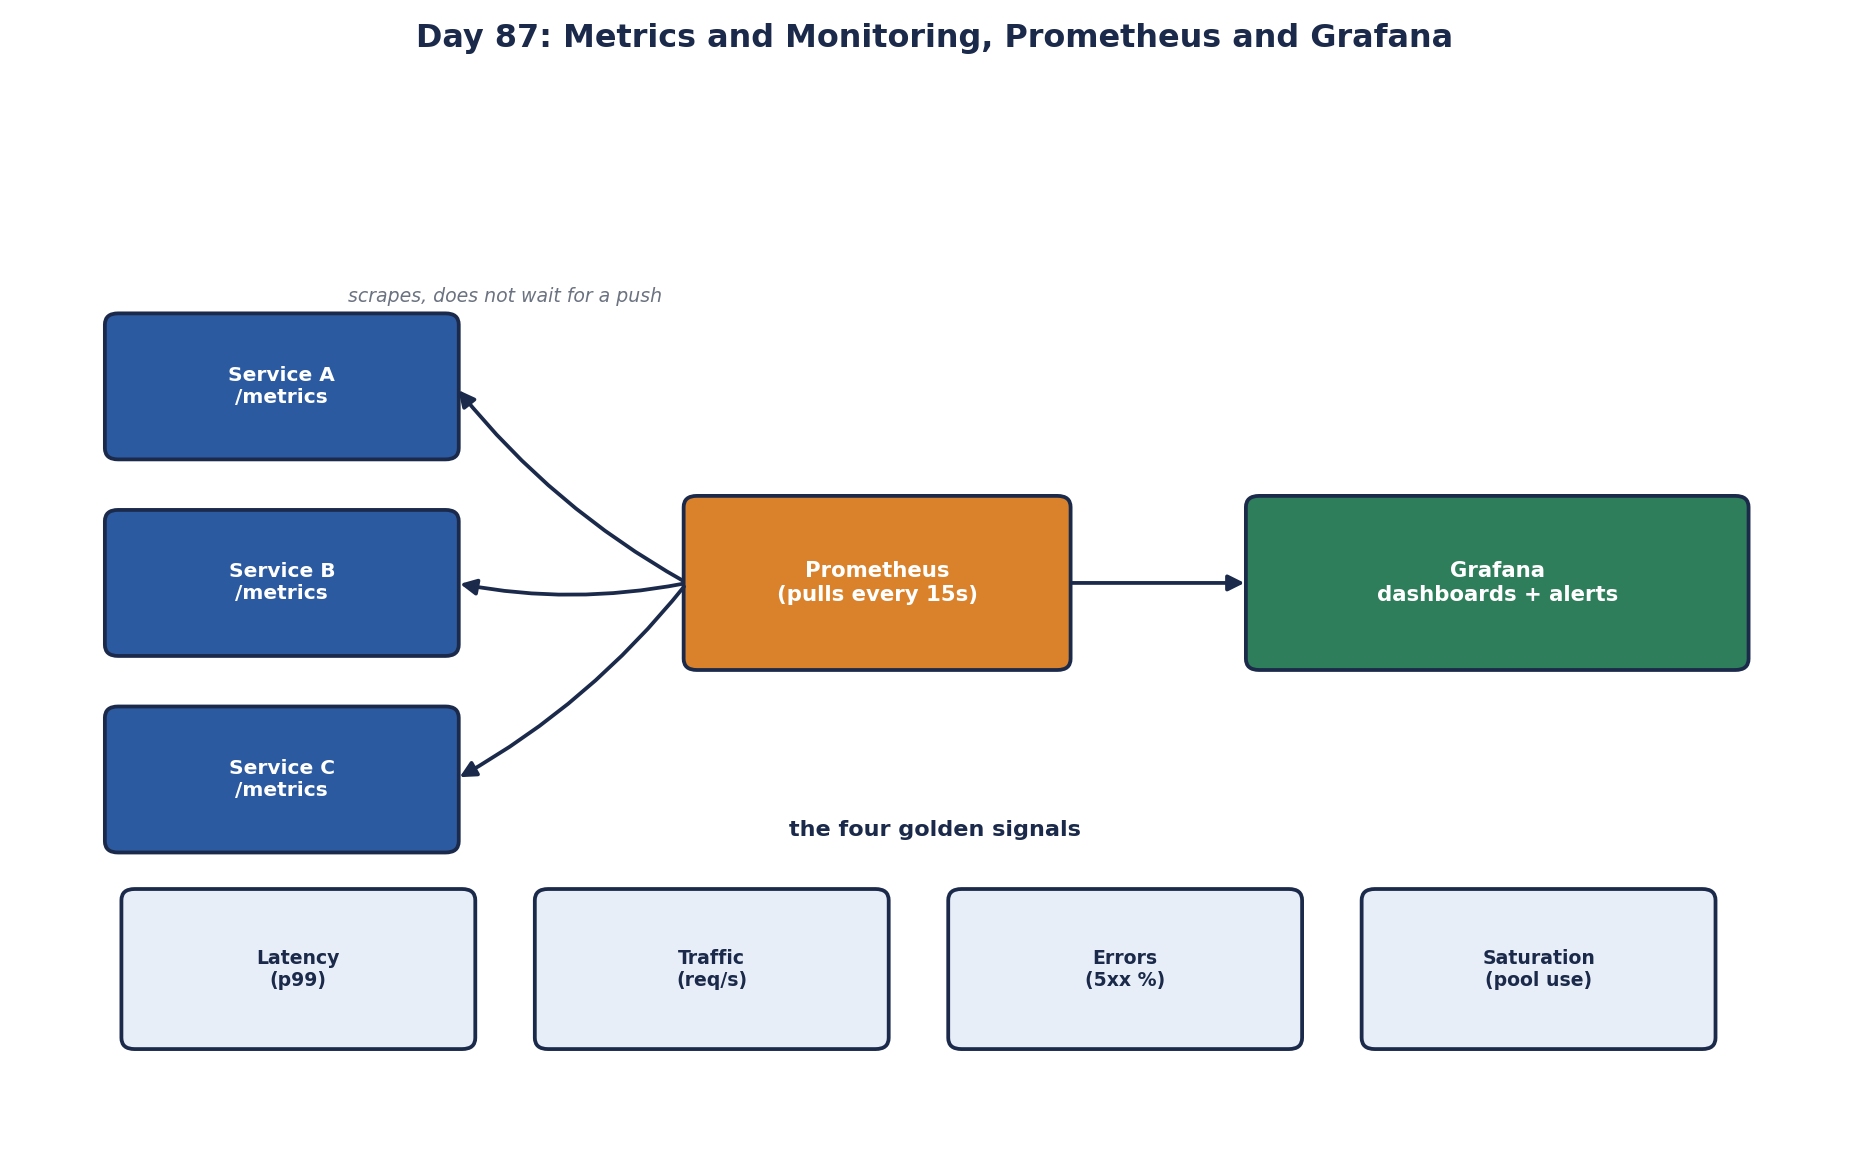
Grafana sits on top: dashboards, and alert rules that notify Slack, email or an on-call tool.
Alert on symptoms, not causes
Alert on what users feel, not on every possible cause:
- Good: "checkout error rate above 2 percent for 5 minutes", "p99 latency above 1 second", or SLO burn-rate alerts (Day 78).
- Noisy: "CPU above 80 percent" on one instance, which often means nothing to users.
Every page should be actionable and urgent; everything else goes to a ticket or a dashboard. With too many alerts, people stop reading them.
Instrumenting services with OpenTelemetry
Use OpenTelemetry metrics or a Prometheus client library (prometheus-net for .NET, client libraries for Java, Go and Python). Frameworks expose HTTP, runtime and database metrics with little code; add business metrics yourself: orders placed, payments failed, sign-ups.
In .NET 8 and later, ASP.NET Core and HttpClient publish standard metrics such as http.server.request.duration through System.Diagnostics.Metrics, and the OpenTelemetry exporter can expose them for Prometheus to scrape. Your own business counters use the same Meter API.
The Observability course builds dashboards and alerts on these signals end to end.
Check yourself
An average hides the slow tail: a few two-second requests barely move it while those users have a terrible experience. A histogram records how many requests fell into each latency bucket, so you can compute p95 and p99, and buckets from many instances can be added together correctly for a fleet-wide view.
The label uses raw paths with ids in them, so every order id creates a new series. Label by route template instead.
Every distinct label value creates a separate time series. With millions of users, a user_id label creates millions of series, so Prometheus's memory use explodes and queries crawl. Keep labels low-cardinality, such as endpoint or status code, and put per-user detail in logs or traces.
The checkout error rate, because real users are failing to pay right now. High CPU on one pod isn't a symptom on its own; it may be harmless, and it belongs on a dashboard or a ticket, not a page.