Distributed Tracing in System Design
On this page
Symptom: p99 is 900 ms, but every service says it's fast
Checkout's p99 latency is 900 ms. Each team checks its own service dashboard: all fine. Logs show the request happened but not where the time went. The missing piece is a view of one request across every service it touched. That's a trace.
Traces and spans explained
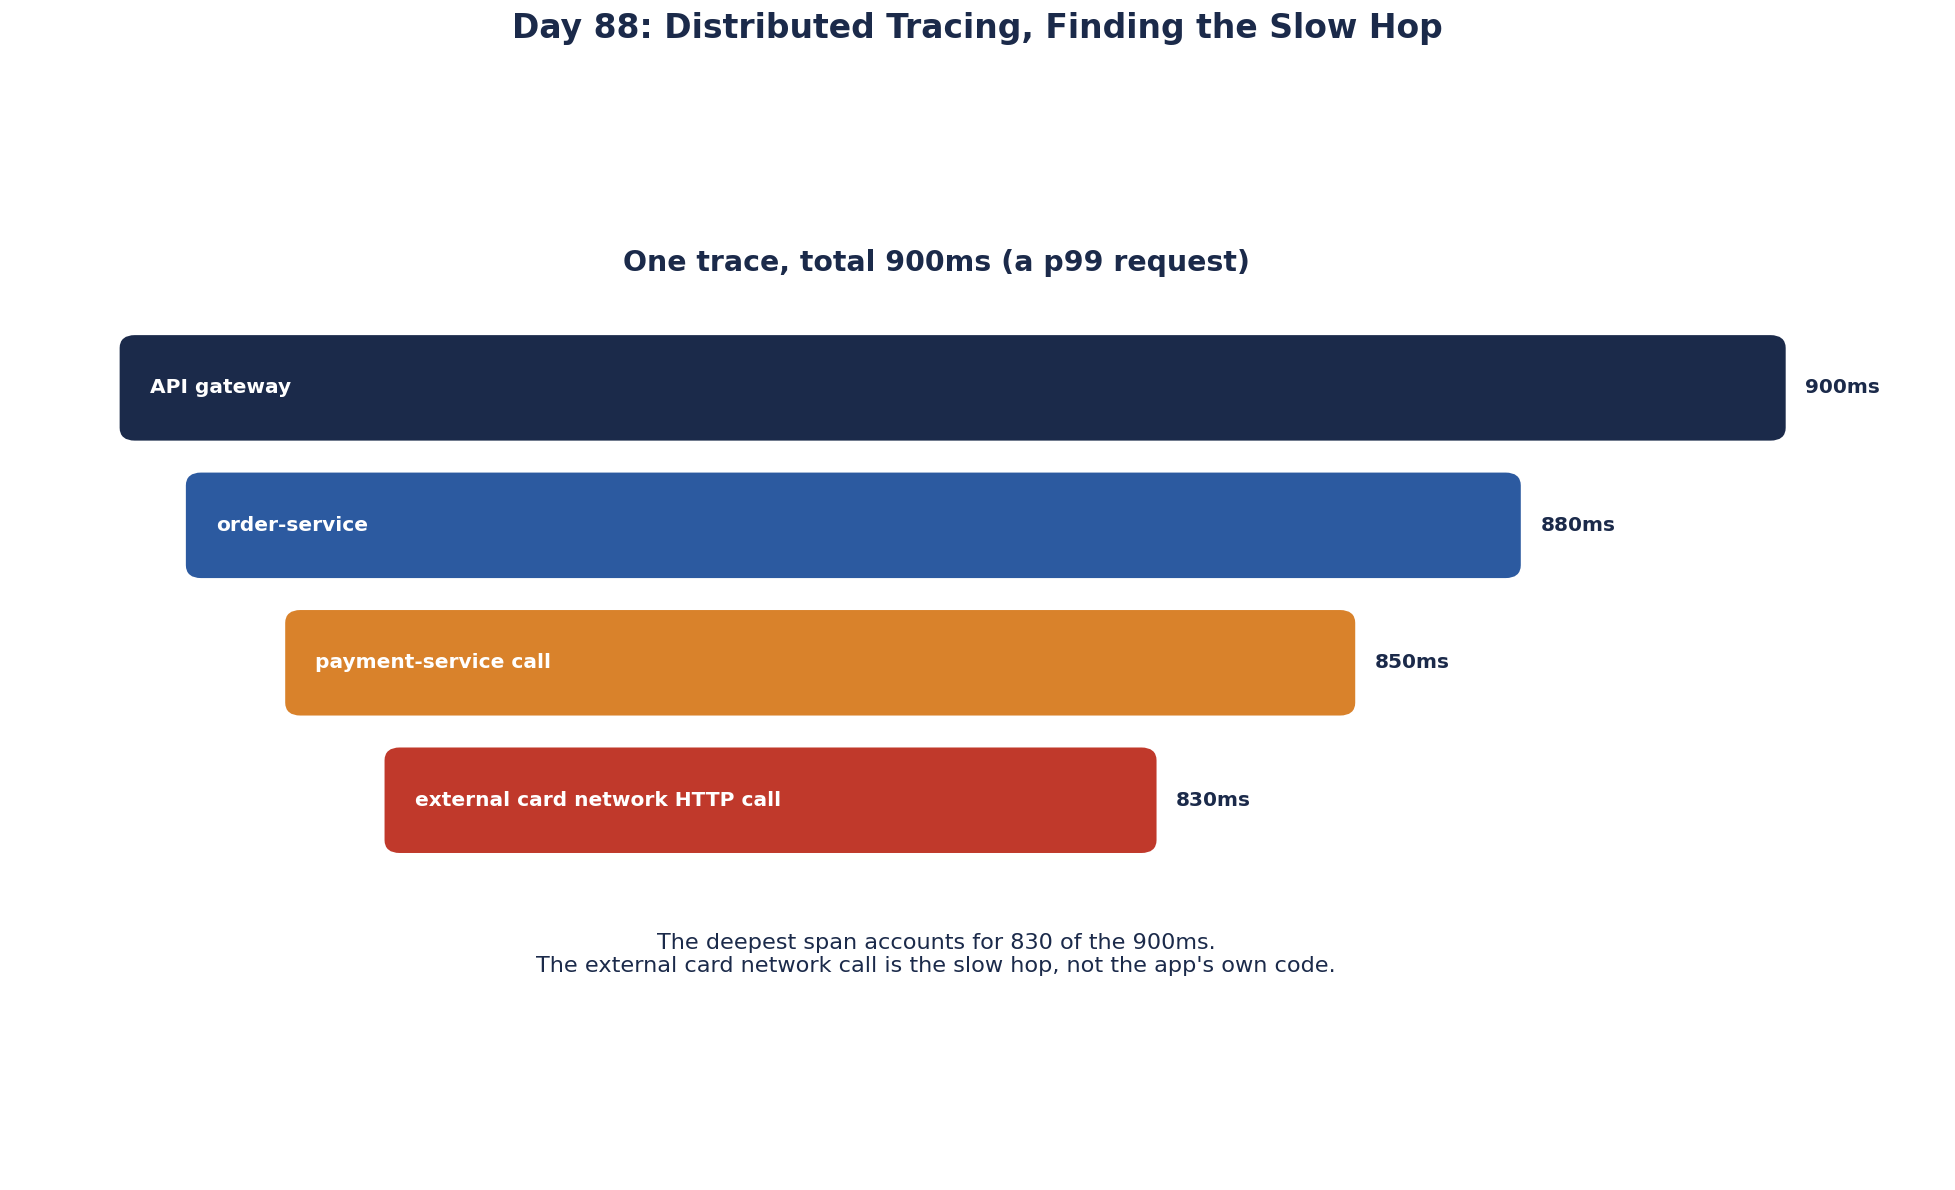
A trace is the record of one end-to-end request. It's made of spans: one per unit of work, such as an incoming HTTP request, a database query or a call to another service. Each span has a start time, a duration, a parent, and attributes like the URL, status code or SQL statement. Together they form a tree:
POST /checkout                                   890 ms   gateway
├─ POST /orders                                  860 ms   order-service
│  ├─ SELECT cart_items ...                       12 ms   postgres
│  ├─ POST /inventory/reserve                     40 ms   inventory-service
│  ├─ POST /payments                             770 ms   payment-service
│  │  ├─ SELECT customer ...                       8 ms   postgres
│  │  └─ POST https://api.acme-pay.example       740 ms   external   <- here
│  └─ publish OrderPlaced                          5 ms   kafka
The answer jumps out: the external payment provider took 740 ms. Without the trace, that's hours of guesswork across four teams.
Context propagation with traceparent
For spans from different services to join one trace, each service passes the trace context along with every call. The W3C Trace Context standard defines a traceparent header:
traceparent: 00-4bf92f3577b34da6a3ce929d0e0e4736-00f067aa0ba902b7-01
              version  trace id (32 hex)       parent span id  sampled
Each service reads it, creates its own spans as children, and sends an updated header on outgoing calls. For messages through queues, the context goes in message headers. Put the same trace id in every log line (Day 86), and you can jump from a trace straight to its logs.
In .NET, a span is a System.Diagnostics.Activity. ASP.NET Core and HttpClient read and send traceparent automatically, so HTTP hops connect with no code. You create your own spans with an ActivitySource for business steps, and you add propagation yourself where no library does it, typically when publishing to and consuming from a message broker without an instrumented client.
OpenTelemetry for distributed tracing
OpenTelemetry (OTel) is the vendor-neutral standard for traces, metrics and logs. Its SDKs and auto-instrumentation create spans for HTTP servers and clients, database drivers and message clients with little or no code; you add spans for important business steps. Data goes through an OpenTelemetry Collector to a backend such as Jaeger, Grafana Tempo, Zipkin, or commercial tools (Datadog, Honeycomb, New Relic, Azure Monitor, AWS X-Ray). The ideas trace back to Google's 2010 Dapper paper.
Trace sampling: head vs tail
Recording every span of every request at high traffic is expensive. Two strategies:
- Head sampling: decide at the start of the request, for example keep 5 percent. Cheap and simple, but it may miss the rare slow or failed request.
- Tail sampling: buffer spans in the collector and decide after the request ends: keep all errors, all requests slower than 1 second, and a small share of the rest. Captures the interesting traces at the cost of more collector resources.
Most teams combine them: a modest head sample plus tail rules for errors and slow requests.
How to read a trace
- Look for the widest span on the critical path.
- Look for gaps between spans: time spent in code you didn't instrument, or waiting for a thread or connection.
- Look for sequences that could be parallel, and N+1 patterns: fifty identical database spans in a row.
- Compare a slow trace with a normal one for the same endpoint.
- Don't trust tiny gaps across services. Span times come from each machine's own clock (Day 61), so a child span can appear to start a few milliseconds before its parent. Read cross-service timing at the level of tens of milliseconds, not single ones.
Be careful what goes into span attributes. Auto-instrumentation can record full SQL statements and URLs with query strings, which may contain emails, tokens or other personal data. Review the attributes your instrumentation records before sending traces to a third-party backend.
Check yourself
Nothing copies the trace context into the message headers and reads it back on consume. Add propagation in the producer and consumer, or use an instrumented client library.
Context propagation: the traceparent header isn't being passed on the call between them, often because of a custom HTTP client or a message queue without header propagation.
The keep-or-drop decision is made after the request finishes, so all errors and slow requests can be kept while sampling down the routine ones.
A trace is the whole journey of one request through the system. A span is one unit of work inside it, such as an HTTP call, a database query or a message being processed, with a start time, duration and a parent span. Spans nest to form the trace's tree.
Look for the longest spans on the critical path, the chain of spans the request had to wait for. Then check whether calls ran in sequence when they could have run in parallel, and whether a span's own time or its children's time dominates.