Linux Monitoring Commands: top, ps, free, df
On this page
Slow Linux server: where to start
Users say the server is slow. In the first minute, answer four questions: is the CPU busy, is memory short, are disks full or slow, and which process is responsible? A handful of commands answer all of them.
What load average means
uptime; nproc 23:11:21 up 2 min, 1 user, load average: 0.12, 0.13, 0.06
2Load average is the average number of processes running or waiting to run (including those stuck in uninterruptible I/O, state D) over 1, 5 and 15 minutes. Compare it with the CPU count (nproc): on this 2-CPU machine, a load of 2 means fully busy, 8 means work queuing up. The three numbers show the trend: 7.85, 6.90, 5.40 would mean load rising.
Picture supermarket checkouts. The CPU count is the number of open tills; the load average is how many shoppers are being served or waiting in line. On 2 tills, a load of 2 means every till is busy with nobody waiting; a load of 8 means six people are queuing.
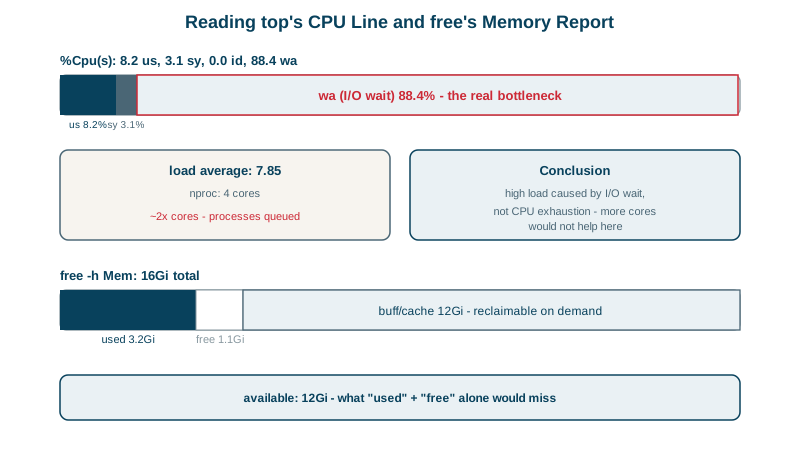
A high load with idle CPUs points at I/O waits, not computation.
Reading top output
top -bn1 -o %CPU | head -5top - 23:11:23 up 2 min, 1 user, load average: 0.12, 0.13, 0.06
Tasks: 137 total, 1 running, 135 sleeping, 0 stopped, 1 zombie
%Cpu(s): 0.0 us, 4.0 sy, 0.0 ni, 92.0 id, 4.0 wa, 0.0 hi, 0.0 si, 0.0 st
MiB Mem : 1950.7 total, 665.1 free, 411.4 used, 966.9 buff/cache
MiB Swap: 0.0 total, 0.0 free, 0.0 used. 1539.3 avail MemThe CPU line, briefly: us user code, sy kernel, id idle, wa waiting for I/O, st stolen by the hypervisor (high on oversubscribed cloud instances). In interactive top: P sorts by CPU, M by memory, 1 shows each CPU, k sends a signal. htop is friendlier; btop prettier.
free -h: read available, not free
free -h total used free shared buff/cache available
Mem: 1.9Gi 411Mi 665Mi 1.0Mi 966Mi 1.5GiLinux uses spare memory as cache for files, so "free" is often small on a healthy server. available (1.5 GiB here) estimates what applications can still get, including reclaimable cache. Worry when available is low and swap use or OOM kills appear (journalctl -k | grep -i oom).
vmstat: a quick time series of CPU, memory and I/O
vmstat 1 5 r b swpd free buff cache si so bi bo in cs us sy id wa st
1 0 0 681292 11848 977844 0 0 0 0 113 123 0 0 100 0 0r processes waiting for CPU, b blocked on I/O, si/so swapping, wa I/O wait. Sustained si/so means memory pressure; high b and wa mean slow storage.
Checking disk I/O with iostat
- Space:
df -h,df -ifor inodes (Day 14). - Throughput and latency:
iostat -xz 1(fromsysstat): high%utilandawaitmean a busy or slow disk. - Which process does I/O:
iotoporpidstat -d 1.
Finding which process is responsible
ps aux --sort=-%cpu | head -5      # top CPU
ps aux --sort=-%mem | head -5      # top memory (RSS = actual RAM)
pidstat 1 5                         # per-process CPU over time
For services, systemctl status app shows memory and CPU used by the whole service's cgroup, and systemd-cgtop ranks services.
Check yourself
Processes are waiting on I/O. On Linux, processes in uninterruptible state D count toward load, so a high load with idle CPU usually means storage or a network filesystem is the bottleneck. Check iostat or the wa column in top.
Linux uses spare memory as file cache, which it releases when applications need it; "available" is the number to watch.
Steal time: the hypervisor is giving CPU time to other virtual machines, so your instance gets less than it expects. Persistent high steal suggests a noisy neighbor or burstable instance credits running out.
Run queue, blocked processes, memory, swap activity, I/O and CPU split over time, which quickly shows whether the problem is CPU, memory or disk.
ps aux --sort=-rss | head lists the top processes by resident memory, or press M in top. RSS is the physical memory a process uses, including shared libraries, so totals can exceed what's actually in use.