Linux Logs and journalctl Tutorial
On this page
What the systemd journal collects
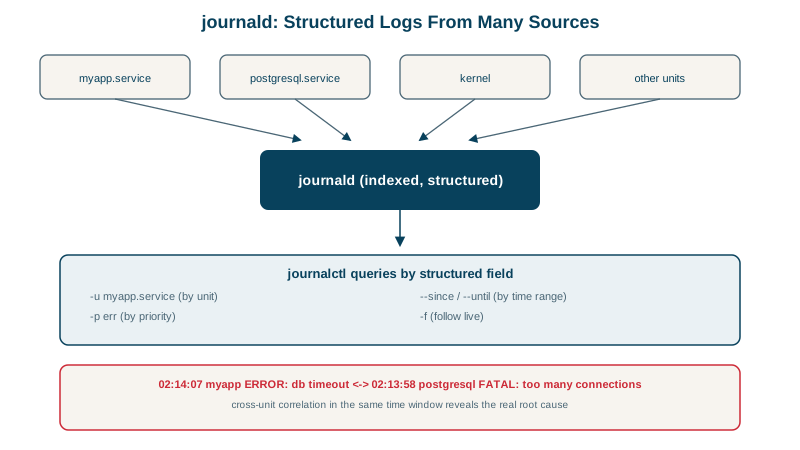
On systemd machines, the journal captures everything a service writes to stdout and stderr, plus kernel messages and system logs, with metadata (unit, PID, priority, timestamps). Many systems also write text files under /var/log/ (nginx access logs, auth.log), but the journal is usually the first place to look.
journalctl filters you'll use daily
| Command | Shows |
|---|---|
journalctl -u myapp | One service |
journalctl -u myapp -f | Follow live |
journalctl -u myapp --since "1 hour ago" | A time window (also --since yesterday, --until "2026-10-14 23:00") |
journalctl -u myapp -b | Since the last boot (-b -1 the boot before) |
journalctl -u myapp -n 50 | Last 50 lines |
journalctl -p err | Priority err and worse |
journalctl -g 'timed out' | Lines matching a pattern |
journalctl -k | Kernel messages (OOM kills, disk errors) |
journalctl -o json | Structured output with all fields |
Combine them: journalctl -u myapp -p warning --since today.
From the crashing service in Day 19:
journalctl -u myapp --since "-1min" -o shortlima-lab python3[10233]: ERROR: connection to database timed out
lima-lab systemd[1]: myapp.service: Failed with result 'exit-code'.
lima-lab systemd[1]: myapp.service: Scheduled restart job, restart counter is at 1.
lima-lab python3[10238]: ERROR: connection to database timed outThe application's own message and systemd's view of the failure, interleaved in order.
The journalctl priority trap
Filtering by priority seems the obvious way to find errors:
journalctl -u myapp -p err --since "-5min"It returned nothing, even though the service had just logged ERROR: connection to database timed out several times. The JSON output explains why:
priority of the ERROR lines: ['6'] (6 = info)Everything a service prints to stdout or stderr is logged at info priority by default. The word "ERROR" in the text means nothing to the journal. Two fixes:
- Prefix lines with a syslog level: systemd recognizes
<3>(err),<4>(warning) and so on at the start of a line. After changing the app to print<3>ERROR: connection to database timed out,journalctl -p errfound it. - Log through a library that writes to the journal with proper priorities (systemd's native protocol), or set
SyslogLevel=in the unit to change the default priority of its output, or log structured JSON to stdout and let your log pipeline parse levels.
Until then, search by text: journalctl -u myapp -g ERROR.
Limiting journal size
- Persistence: if
/var/log/journal/exists, logs survive reboots; otherwise they live in memory under/run. - Size:
journalctl --disk-usage; cap it withSystemMaxUse=1Gin/etc/systemd/journald.conf, or clean up withjournalctl --vacuum-time=14d. - Rate limits: journald drops messages from services that log too fast, noting "Suppressed N messages".
- Central logging: ship logs off the machine (Vector, Fluent Bit, the OpenTelemetry Collector, or
systemd-journal-upload), so they survive the server and can be searched across many machines (see the observability course).
Text log files in /var/log and logrotate
For files under /var/log/, use the tools from earlier days: tail -F, less +F, grep, awk. logrotate rotates and compresses them; make sure services reopen their files after rotation (Day 14 shows what happens when they don't).
Check yourself
Output to stdout and stderr is logged at info priority by default; the word ERROR in the text doesn't set the priority.
journalctl -k shows kernel messages from the journal, and dmesg reads the kernel ring buffer directly. Search for Out of memory or oom-kill to find which process was killed.
journalctl -u service -b. Add -f to follow new lines, --since "1 hour ago" to narrow by time, or -b -1 for the previous boot.
Set SystemMaxUse in /etc/systemd/journald.conf and restart journald for a permanent limit, or run journalctl --vacuum-size=500M to shrink it immediately. Without a limit, the journal can use up to 10 percent of the filesystem.
It rotates, compresses and deletes old text log files on a schedule, with options to signal services to reopen their logs.