Observability vs Monitoring: What Is the Difference?
On this page
The question your dashboard can't answer
Checkout latency is up. The dashboard confirms it: the average went from 180 ms to 400 ms. Then the real questions start. Which customers? Which payment provider? Only on mobile? Only since the 14:30 deploy? If the data to answer those wasn't collected, or was averaged away, you're guessing.
Observability vs monitoring: two different jobs
Monitoring watches for known failure modes. You decide in advance what matters (error rate, CPU, queue depth), collect it, and alert when it crosses a threshold. It answers "is the thing I worried about happening?"
Observability is a property of a system: how well you can understand its internal state from the outside, using the telemetry it emits. It answers questions you didn't think of in advance: "why is this slow, for these users, right now?"
| Monitoring | Observability | |
|---|---|---|
| Questions | Known in advance | New, asked during an investigation |
| Data | Pre-aggregated metrics on fixed dimensions | Rich events, traces and logs with many attributes |
| Typical output | Dashboards and threshold alerts | Ad hoc queries, slicing by any attribute |
| Good at | Detecting that something is wrong | Explaining why |
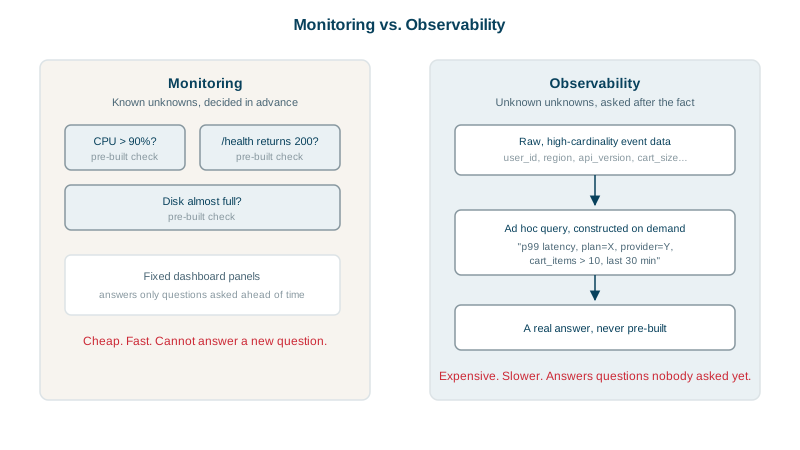
Why distributed systems need observability
In a single application on one server, a stack trace and a log file often explained everything. In a system of dozens of services, queues, caches and third-party APIs, one request crosses many processes. Failures are increasingly novel: a combination of a slow dependency, a specific customer's data shape and a new release. You can't write a dashboard for every combination in advance.
Monitoring vs observability in practice: two queries
A monitoring query answers a fixed question, average checkout latency:
sum(rate(http_request_duration_seconds_sum{route="/checkout"}[5m]))
/
sum(rate(http_request_duration_seconds_count{route="/checkout"}[5m]))
An observability investigation asks a new one: "p99 latency for /checkout, broken down by customer.plan and payment.provider, for requests since 14:30". That only works if each request's telemetry carries those attributes, usually as span attributes on traces or fields on structured events (Days 3 and 16), and your tools can group by any of them.
What makes a system observable
- Rich context on every event: request IDs, user and tenant, version, feature flags, dependency names.
- Correlation: metrics, logs and traces share identifiers so you can jump between them (Day 19).
- High-cardinality support where it matters: being able to filter by a single customer or order (Day 7).
- Instrumentation as part of development, not added after the first outage (Day 27).
You still need monitoring: alerts must fire on known, user-visible symptoms (Day 23). Observability is what you use after the alert, to find out why.
A home comparison: monitoring is the smoke alarm. It's essential, and it tells you there's a problem in a place you predicted. Observability is being able to walk into any room, open any cupboard and look, so you can find a problem nobody installed an alarm for.
Check yourself
Monitoring checks predefined signals for problems you already know to look for, like error rate above 1 percent. Observability lets you investigate new, unpredicted questions, such as why only Android users in Brazil are slow, from rich telemetry you can slice any way.
The averages were aggregated without a provider dimension, so the information needed to isolate that provider was thrown away when the data was collected. One provider's slowdown just nudges the overall average. You need per-request data with the provider attached.
Yes. Monitoring detects known, user-visible problems and alerts on them around the clock; observability helps you explain them, including failures nobody predicted. One tells you something is wrong, the other helps you find out why.
Rich telemetry with high-cardinality context, like user, region and version, on wide events, traces and structured logs, so you can slice data along any dimension during an investigation.
A single request crosses many services, queues and databases, so failures emerge from interactions, like a retry storm or a slow shared dependency, that no single service's dashboard shows. You need telemetry that follows the request across boundaries.