Metric Types: Counters, Gauges and Histograms
On this page
The three metric types
A metric is a number sampled over time, identified by a name and labels. Each unique name-plus-labels combination is one time series: a list of (timestamp, value) pairs, such as the request count for one route on one instance, recorded every 15 seconds. Most instrumentation libraries (Prometheus clients, OpenTelemetry) offer the same core types, and picking the right one decides which questions you can answer later.
Counters: values that only go up
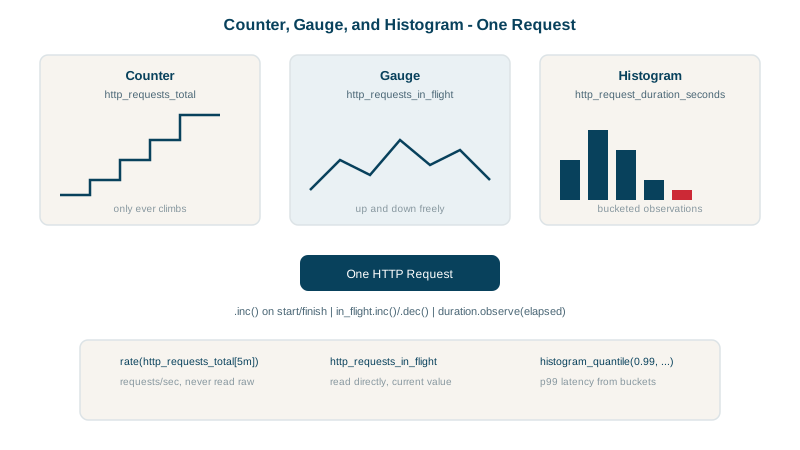
A counter counts things that happen: requests, errors, bytes sent. It only increases, and resets to zero when the process restarts.
const requests = new client.Counter({
  name: 'http_requests_total', help: 'HTTP requests', labelNames: ['route', 'method', 'status'],
});
requests.inc({ route, method: req.method, status: String(res.statusCode) });
The raw value ("165 requests since this process started") is rarely useful. Query its rate instead:
sum by (instance) (rate(http_requests_total{route="/orders/:id/checkout"}[1m])){"instance": "127.0.0.1:9101"} 51.16
{"instance": "127.0.0.1:9102"} 52.36About 51 and 52 requests per second on the two instances of the lab service. rate() also handles counter resets after restarts (Day 9). Name counters with a _total suffix.
Gauges: values that go up and down
A gauge is a current value: requests in flight, queue depth, memory used, temperature.
const inFlight = new client.Gauge({ name: 'http_requests_in_flight', help: 'In-flight requests' });
inFlight.inc();   // request starts
inFlight.dec();   // request finishes
Read gauges directly, or aggregate them with sum, max, avg. Don't rate() a gauge. Gauges sampled every 15 seconds miss spikes between scrapes; if short peaks matter, track a maximum or use a histogram.
Histograms: measuring distributions
A histogram counts observations into buckets, so you can compute percentiles and see the shape of a distribution, not just the average:
const duration = new client.Histogram({
  name: 'http_request_duration_seconds', help: 'Request duration', labelNames: ['route'],
  buckets: [0.025, 0.05, 0.1, 0.25, 0.5, 1, 2.5],
});
const end = duration.startTimer();
// ... handle the request ...
end({ route });
It exposes one cumulative counter per bucket (le means "less than or equal"), plus _sum and _count. From the lab service, a few seconds into a load test:
http_request_duration_seconds_bucket{le="0.025",route="/orders/:id/checkout"} 0
http_request_duration_seconds_bucket{le="0.05",route="/orders/:id/checkout"} 103
http_request_duration_seconds_bucket{le="0.1",route="/orders/:id/checkout"} 164
http_request_duration_seconds_bucket{le="1",route="/orders/:id/checkout"} 166
http_request_duration_seconds_bucket{le="+Inf",route="/orders/:id/checkout"} 166
103 of 166 requests took 50 ms or less; 2 took between 0.25 s and 1 s. Percentiles come from histogram_quantile (Day 10), and "what fraction finished under 250 ms?" is a simple ratio of buckets, which is exactly what latency SLOs need (Day 22).
Counter vs gauge vs histogram: which to use
| You want | Use |
|---|---|
| How often something happens | Counter, queried with rate() |
| A current level | Gauge |
| Latency, sizes, any distribution | Histogram |
Summaries also exist, computing percentiles in the client; Day 10 explains why histograms are usually the better choice.
Check yourself
The raw cumulative total depends on when the process last started, so it's not meaningful on its own. rate() gives the per-second increase over a window, showing current activity, and handles counter resets after restarts correctly.
Errors are events that accumulate; a counter records them reliably, while a gauge only reflects a value at scrape time.
103 observed requests took 0.05 seconds or less. Prometheus histogram buckets are cumulative, so this count also includes everything in the smaller buckets, and the +Inf bucket equals the total count.
When it measures a current value that can go up and down, such as queue length, memory used or active connections.
The total of all observed values and the number of observations, so rate(_sum) / rate(_count) gives average latency over a window.