High Cardinality in Metrics Explained
On this page
How one label created 9,259 time series
A developer wants to know which URLs are busiest and adds the request path as a label:
const badPath = new client.Counter({
  name: 'http_requests_by_raw_path_total', help: 'Anti-pattern: unbounded label', labelNames: ['path'],
});
badPath.inc({ path: req.originalUrl });     // "/orders/48213/checkout", "/orders/99204/checkout", ...
Every distinct order ID creates a new time series. After a few minutes of load on the lab service, Prometheus's own statistics showed:
head series 9518
  http_requests_by_raw_path_total 9259
  nodejs_gc_duration_seconds_bucket 42
  http_request_duration_seconds_bucket 32
  nodejs_heap_space_size_used_bytes 26
One counter created 9,259 series, 97% of everything Prometheus was storing, and it grows with every new order forever. The well-designed metrics next to it, labeled by route template, needed 6 series for the request counter and 32 for the entire latency histogram.
What is metric cardinality?
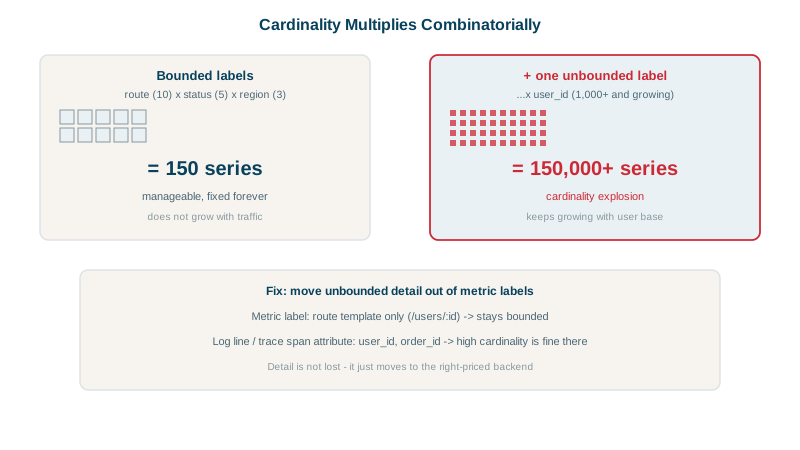
Cardinality is the number of unique time series a metric produces: the product of the distinct values of each label. http_requests_total with 5 routes × 4 methods × 10 status codes can produce up to 200 series. Add user_id with a million users, and it can produce 200 million.
In Prometheus-style systems, each series costs memory for its index and recent samples, and storage for its history. High cardinality causes slow queries, out-of-memory crashes and, on hosted platforms, very large bills (they charge per series).
Safe vs unsafe metric labels
| Usually fine (bounded) | Dangerous (unbounded or huge) |
|---|---|
Route template (/orders/:id/checkout) | Raw URL path or query string |
HTTP method, status code or class (5xx) | User ID, email, session ID |
| Service, instance, region, version | Order, request or trace ID |
| Error type | Error message (often contains IDs) |
Customer plan (free, pro) | Timestamps or durations as label values |
The fix in the lab service: label by req.route.path (the template), not req.originalUrl. Express gives you the template after routing; most frameworks do.
Where high-cardinality data belongs
You often do need per-user or per-order detail during an investigation. Put it where it's cheap:
- Traces and structured logs carry user IDs, order IDs and other unique values as attributes (Days 3 and 16).
- Exemplars attach a trace ID to a histogram bucket sample without creating new series (Day 19).
- Event-based tools built for high cardinality (columnar stores) can query them directly.
How to keep cardinality under control
- Review new labels in code review: "how many distinct values can this have?"
- Watch series counts per metric (
/api/v1/status/tsdbin Prometheus, cardinality dashboards in hosted tools) and alert on sudden growth. - Drop or relabel offending labels at scrape time or in the collector as an emergency fix.
- Set limits: Prometheus's
sample_limitandlabel_limitper scrape job stop one bad target from taking down the server.
Check yourself
Each distinct URL, containing a different order ID, is a new label value, and each value creates a separate time series.
Record the order id on traces and structured logs, which handle high cardinality well, or attach it as an exemplar. Keep metric labels bounded to things like route, method and status.
Up to 5 × 4 × 10 = 200 series, since every combination of label values can become a separate series. Adding one more label with 50 values would multiply that to 10,000.
Anything unbounded: user ids, emails, request ids, raw URLs, full error messages and IP addresses. Each new value creates a new time series, so these labels grow series without limit, driving up memory and cost until the metrics system struggles.
Check the Prometheus TSDB status page or query series counts per metric and per label to find the metrics and labels with the most series.