Spans, Trace Context and Context Propagation
On this page
Anatomy of a span
| Field | Example | Purpose |
|---|---|---|
| Trace ID | 7ef871bcd8a4c5fbaad54c198c646ffc (16 bytes) | Shared by every span in the request |
| Span ID | 636036e7481206bf (8 bytes) | Unique to this span |
| Parent span ID | 6401ee8574c45d39 | Builds the tree |
| Name | GET, charge_card | Low-cardinality operation name (not the full URL) |
| Kind | server, client, internal, producer, consumer | Role in the interaction |
| Start time, duration | 133 ms | Timing |
| Status | OK, ERROR | Failure marking |
| Attributes | http.response.status_code=200, payment.provider=acme-pay | Searchable context, including high-cardinality values |
| Events | "retrying", exception details | Timestamped points inside the span |
A manual span in the lab's checkout service, with an attribute:
await tracer.startActiveSpan('charge_card', async (span) => {
  span.setAttribute('payment.provider', 'acme-pay');
  await chargeCard();
  span.setStatus({ code: SpanStatusCode.OK });
  span.end();
});
startActiveSpan makes it the current span, so anything started inside it (an HTTP call, a database query) becomes its child automatically.
The W3C traceparent header explained
Between services, context travels in the W3C Trace Context header:
traceparent: 00-7ef871bcd8a4c5fbaad54c198c646ffc-636036e7481206bf-01
             |  |                                |                |
         version  trace ID                         parent span ID  flags (01 = sampled)
In the lab, the inventory service printed the header it received:
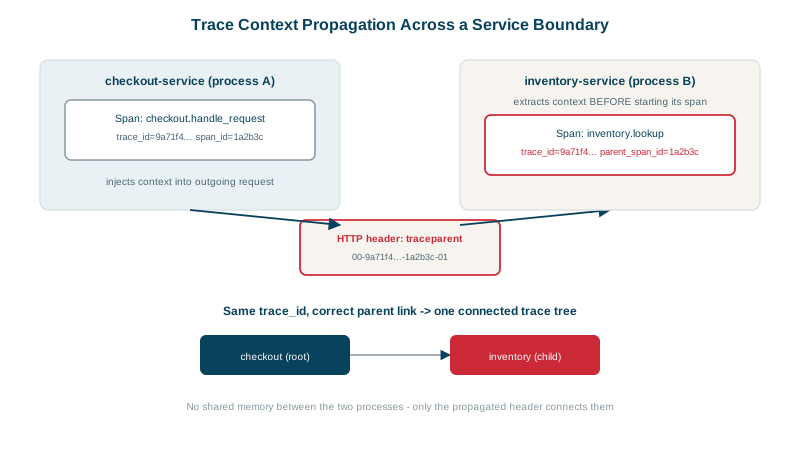
[inventory] incoming traceparent: 00-7ef871bcd8a4c5fbaad54c198c646ffc-636036e7481206bf-01636036e7481206bf is the span ID of the checkout service's outgoing client span, the GET that called inventory. Inventory created its server span as a child of it, under the same trace ID:
checkout   GET          133 ms  span=636036e7481206bf     <- client span; its ID was sent in traceparent
  inventory  GET        125 ms  span=d92d6e1577986d27     <- server span, child of 636036e7...
The 8 ms difference between the two is network and connection time. The companion tracestate header carries vendor-specific data, and baggage (baggage: tenant=acme,plan=pro) carries application key-values downstream; don't put secrets or personal data in baggage, since it's sent to every downstream service, including third parties.
Context propagation across HTTP, queues and async code
- HTTP and gRPC: OpenTelemetry auto-instrumentation injects and extracts headers for common clients and servers, as it did in the lab with no manual code.
- Message queues: put the context in message headers (Kafka record headers, SQS message attributes). The consumer's span uses the producer's span as parent, or as a link when one consumer processes a batch of messages from many traces.
- Async work in-process: context must follow promises, thread pools and goroutines. Node's async context and Java's context propagation usually handle it; custom thread pools and callbacks are where it gets lost.
- Gateways and proxies must forward
traceparent(Envoy, NGINX with modules, cloud load balancers can also start traces). - Third-party calls: you'll see your client span even if the provider doesn't continue the trace.
When traces show up broken into pieces, look for the hop that drops the header.
Check yourself
Version, the 128-bit trace id, the 64-bit parent span id, and trace flags, whose sampled bit tells downstream services whether this trace is being recorded. For example: 00-<trace-id>-<span-id>-01.
The outgoing HTTP client span was the active span when the call was made, so it became the parent of inventory's server span.
Inject the trace context into the message headers when producing, and extract it when consuming to parent or link the consumer span.
It carries vendor-specific data alongside traceparent, such as sampling decisions or tenant information. Systems that don't understand an entry pass it along unchanged, so different tracing vendors can coexist in one request path.
Callbacks, thread pools and promises can run without the active context. OpenTelemetry context managers carry it, but custom pools may need explicit wrapping.