Push vs Pull Metrics Collection
On this page
Push vs pull metrics collection
- Pull: the monitoring system asks each target for its current metrics on a schedule (Prometheus scraping
/metrics, Day 8). - Push: each application sends metrics to a collector or backend (StatsD, the OpenTelemetry Protocol (OTLP), CloudWatch's
PutMetricData, Datadog agents).
Neither is universally better; each fits different workloads.
| Pull | Push | |
|---|---|---|
| Knows when a target is down | Yes: the scrape fails, up == 0 | Only by noticing silence, which looks the same as "no traffic" |
| Target configuration | Needs no idea where monitoring lives | Needs the collector's address |
| Discovery | The server must find targets (service discovery) | Targets announce themselves |
| Short-lived jobs | Can finish before the next scrape | Push before exiting |
| Firewalls and NAT | Server must reach every target | Targets only need outbound access |
| Load control | Server controls scrape rate | Many clients can flood a collector |
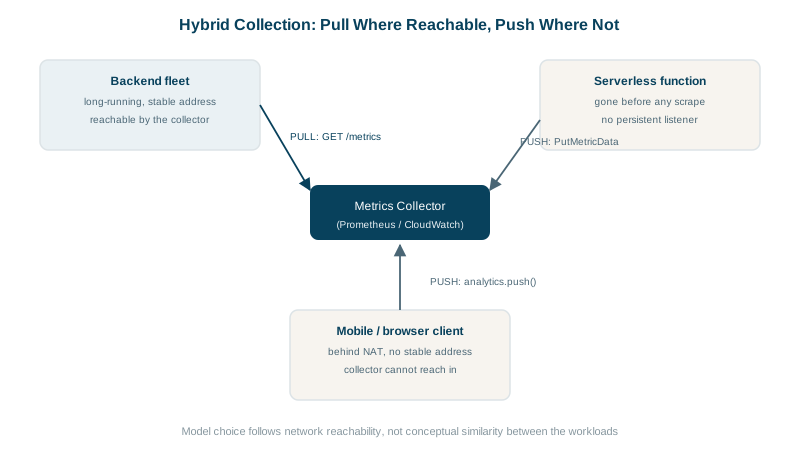
Where pull breaks down: batch jobs, serverless, NAT
Batch and cron jobs. A nightly job runs for 40 seconds. With a 60-second scrape interval it may never be scraped. The job should push its final results to the Prometheus Pushgateway, which Prometheus then scrapes:
cat <<'METRICS' | curl --data-binary @- http://pushgateway:9091/metrics/job/nightly_billing
# TYPE billing_job_last_success_timestamp_seconds gauge
billing_job_last_success_timestamp_seconds 1791737542
# TYPE billing_job_invoices_processed gauge
billing_job_invoices_processed 18240
METRICS
Scrape it with honor_labels: true so the pushed job label is kept (this config passes promtool check config):
scrape_configs:
  - job_name: pushgateway
    honor_labels: true
    static_configs:
      - targets: ["pushgateway:9091"]
Then alert on staleness: time() - billing_job_last_success_timestamp_seconds > 26 * 3600 catches a job that stopped running entirely.
Use the Pushgateway only for job-level results. It's not a general push endpoint: it never forgets a metric until deleted, so it would report dead instances' values forever, and it becomes a single point of failure.
Serverless functions (Lambda, Cloud Run jobs) have no stable address to scrape and freeze between invocations. Use the platform's built-in metrics, the Embedded Metric Format in logs, or push with OTLP through a collector extension.
Targets behind NAT or in customer networks can't be reached by your server; they push, or run a local agent that scrapes and forwards.
The common hybrid: agents and collectors
Most current setups combine both through the OpenTelemetry Collector or a Prometheus agent:
- Long-running services expose
/metricsand are scraped locally by an agent, or push OTLP to a nearby collector. - The agent or collector pushes everything to a central backend with
remote_writeor OTLP (Day 14).
You get pull's liveness detection near the workload and push's simplicity across networks.
Check yourself
The job may start and finish between scrapes, so its metrics are never collected; it should push its results instead.
It keeps the last pushed values forever, so a dead instance's metrics look current and healthy, and you lose the up signal pull gives you. It also becomes a bottleneck and single point of failure for every service pushing to it.
The scrape fails and the target's up metric becomes 0, which can be alerted on directly. With push, silence could mean either a dead target or a healthy one with nothing to report.
Applications push OTLP to a nearby collector, which can expose or forward the data to Prometheus or other backends, giving each side the model it prefers.
Push them, through the platform's metrics integration, such as CloudWatch embedded metrics, or to an OTLP endpoint on a collector. Short-lived instances can't be scraped reliably because they may not exist when the scraper arrives.