Log Levels, Log Sampling and Log Volume
On this page
Why log volume needs managing
A busy service logs every request at INFO. The logging bill becomes one of the largest infrastructure costs, and searches are slow. So someone enables 1% sampling, and the next incident can't be investigated because the failing requests weren't kept. Volume management is about keeping the useful logs, not just fewer of them.
How to use log levels: ERROR, WARN, INFO, DEBUG
| Level | Use for | Production default |
|---|---|---|
| ERROR | Something failed and needs attention: a request couldn't be served | Always on |
| WARN | Something unexpected but handled: a retry, a fallback, a deprecated call | Always on |
| INFO | Significant business events: order placed, user signed up, job finished | On, but not one per routine step |
| DEBUG | Detail for developers diagnosing a problem | Off; turn on temporarily, per service or per request |
| TRACE | Very fine-grained flow | Off |
Two habits matter most: errors should be actionable (if nobody would act on it, it's not an error), and levels should be changeable at runtime without a deploy, so you can raise DEBUG for one service during an incident.
Why uniform log sampling discards errors
The test: one million log events, 0.1% of them errors, 1% of them slow requests. Two strategies:
const uniform = e => Math.random() < 0.01;                          // keep 1% of everything

function importance(e) {
  if (e.level === 'error' || e.level === 'warn') return true;          // keep every error
  if (e.durationMs > 1000) return true;                                // keep every slow request
  return Math.random() < 0.01;                                         // sample the routine rest
}uniform 1% kept 9861 lines | errors kept 11 of 1041 | slow kept 82 of 9802
importance-aware kept 20770 lines | errors kept 1041 of 1041 | slow kept 9802 of 9802Uniform sampling kept 11 of 1,041 errors: about 1% of the evidence. Importance-aware sampling kept about twice as many lines in total but every error and slow request, and still cut volume by 98%.
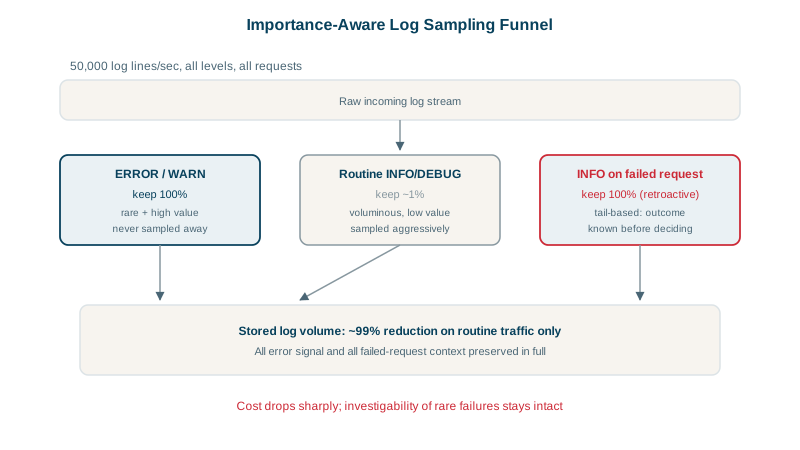
When you sample, record the sample rate on each kept line (sample_rate: 100), so counts can be scaled back up, and sample by request (trace ID) rather than by line, so a kept request keeps all its lines.
Other ways to reduce log volume
- Don't log what metrics already count. A log line per successful request duplicates
http_requests_total. - Drop noisy health checks and readiness probes.
- Aggregate repeated messages ("connection refused, repeated 4,812 times in 60 s").
- Tiered retention: recent logs in fast, searchable storage; older ones in cheap object storage, rehydrated when needed (Day 26).
- Filter in the pipeline: collectors like the OpenTelemetry Collector, Vector or Fluent Bit can drop, sample and redact before data reaches a paid backend.
Check yourself
It discards 99 percent of errors along with routine logs, so the rare failures you most need to investigate are mostly gone. Errors are a tiny share of traffic, so uniform sampling keeps lots of boring successes and almost none of the interesting cases.
So counts derived from logs can be scaled back up: a line kept at a 1 in 100 rate stands for 100 events. Without it, dashboards built on sampled logs undercount by an unknown factor.
Temporarily and narrowly, for a specific service, user or request during an investigation, ideally switched at runtime without a deploy, then turned off again. Always-on DEBUG floods storage and can expose sensitive data.
Keep every error and slow request, and sample only routine successes, possibly with different rates per endpoint so quiet endpoints keep enough data. Record the sample rate on each event so counts can be scaled back up.
Dropping noisy health check logs, aggregating repeated messages, shortening retention for verbose logs, and turning frequent log lines into metrics.