RED vs USE Method: What to Measure
On this page
Too many metrics: what should you measure?
A default exporter gives you hundreds of metrics per process. During an incident, nobody knows which ones matter. Two methods give a starting point: RED for request-driven services, and USE for the resources underneath.
The RED method: rate, errors, duration
Tom Wilkie's RED method measures what users experience:
- Rate: requests per second.
- Errors: failed requests per second, or as a fraction.
- Duration: how long requests take, as a distribution (percentiles).
From the lab's checkout service under load:
# Rate
sum(rate(http_requests_total{route="/orders/:id/checkout"}[1m]))                         # ~103 req/s

# Errors, as a ratio
sum(rate(http_requests_total{route="/orders/:id/checkout", status=~"5.."}[5m]))
/ sum(rate(http_requests_total{route="/orders/:id/checkout"}[5m]))                       # 0.01957

# Duration, p99
histogram_quantile(0.99,
  sum by (le) (rate(http_request_duration_seconds_bucket{route="/orders/:id/checkout"}[5m])))   # ~1.0 s
About 103 requests a second, a 2% error rate (the service is built to fail 2% of the time), and a p99 near one second. Three numbers per endpoint that tell you whether users are happy. Google's four golden signals add saturation to these (Day 21 of the networking course discusses them).
The USE method: utilization, saturation, errors
Brendan Gregg's USE method checks each resource (CPU, memory, disks, network, connection pools, thread pools, queues):
- Utilization: how busy it is (percent of capacity used, or time busy).
- Saturation: work waiting because it's full (queue length, wait time).
- Errors: error events for that resource (I/O errors, rejected connections).
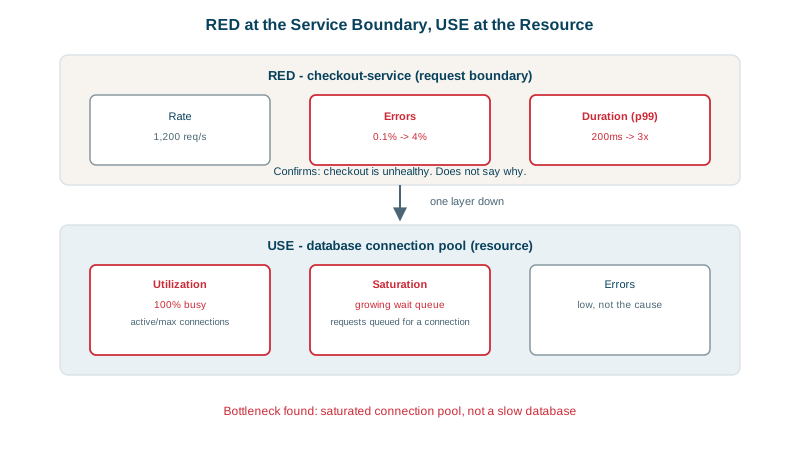
Using RED and USE together to find a bottleneck
RED tells you that a service is unhealthy; USE helps find why. Checkout p99 jumps, so RED is red. Walk USE over checkout's resources:
db_pool_active_connections / db_pool_max_connections        # Utilization: at 100%?
db_pool_pending_acquires                                    # Saturation: requests waiting for a connection?
rate(db_pool_acquire_timeouts_total[5m])                    # Errors: timing out waiting?
If the pool is at 100% with a growing queue, the bottleneck is the pool (or the slow queries holding connections), not CPU. These pool metrics aren't defaults; instrumenting them is exactly what USE prompts you to do.
Building dashboards and alerts from RED and USE
- Alert on RED symptoms that users feel, ideally through SLOs (Day 23).
- Dashboard USE for each resource, for investigation rather than paging.
- One RED row per service on an overview dashboard makes it obvious which service is unhealthy (Day 12).
Check yourself
RED: Rate, Errors, Duration, for request-driven services, describing what users experience. USE: Utilization, Saturation, Errors, for resources like CPU, disks and connection pools, describing how close they are to their limits.
RED, because rate, errors and duration measure what users actually experience. USE metrics, like 90 percent CPU, often look alarming without any user impact, so they suit dashboards and investigation better than pages.
Saturation: work is queued because the resource is full. Utilization says the pool is busy; saturation says demand exceeds it, which is when latency climbs.
RED metrics show which service is hurting users, through rising errors or latency. USE metrics on that service's resources, like CPU, connection pools and disks, then show which resource is saturated and causing it. Symptom first, then cause.
RED panels for its main endpoints, then USE panels for its key resources, so the path from symptom to cause is short.