Reducing Observability Costs at Scale
On this page
Why observability costs grow so fast
It's common for observability spending to become one of the largest line items in an engineering budget, sometimes rivaling the cost of the systems being observed. Most of that spend isn't buying insight: it's duplicate logs, unbounded labels and traces nobody opens. Reducing it is mostly a matter of finding that waste.
What drives observability cost
| Signal | Main cost driver | Typical waste |
|---|---|---|
| Metrics | Active time series (cardinality) | Unbounded labels, per-pod series nobody queries, unused default metrics |
| Logs | Bytes ingested, indexed and retained | DEBUG in production, a log line per successful request, long hot retention |
| Traces | Spans stored | Keeping 100% of healthy traffic, spans for trivial internal calls |
An observability cost review with real numbers
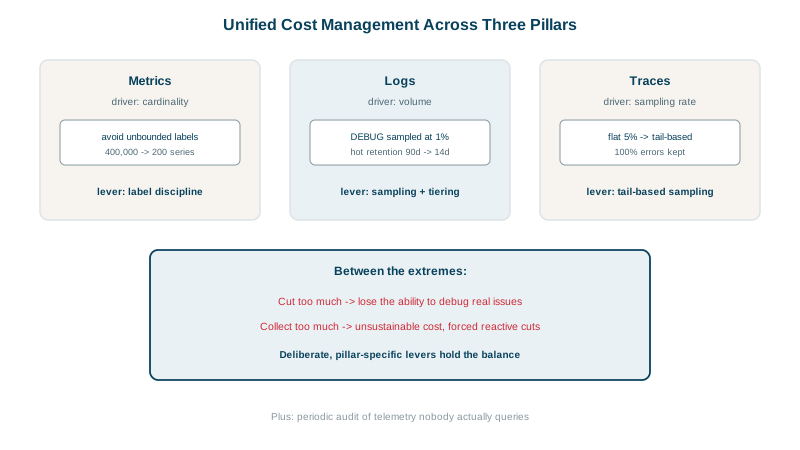
Metrics. In this course's lab, one counter labeled by raw URL produced 9,259 series in a few minutes, 97% of all series stored (Day 7). Relabeled by route template, the same information needed 6 series. On a hosted platform that charges per active series, that one label would dominate the bill and keep growing with every new order ID.
# Find the biggest metrics by series count
topk(10, count by (__name__) ({__name__=~".+"}))
Prometheus's /api/v1/status/tsdb endpoint and hosted cardinality dashboards show the same per metric and per label.
Logs. Group ingested volume by service and level. The usual findings: health check access logs, DEBUG left on after an incident, and every request logged at INFO even though metrics already count requests. Importance-aware sampling (Day 4) kept every error while cutting volume by 98% in the lab test.
Traces. Tail sampling (Day 18) kept 8% of traces while keeping 100% of errors and slow requests.
Cost controls that keep the signal
- Filter in the pipeline: drop, sample, aggregate and redact in the OpenTelemetry Collector or Vector before data reaches a paid backend. It's the cheapest place to cut.
- Aggregate before storing: recording rules that keep per-service series long-term instead of per-pod (Day 14); span metrics generated before trace sampling.
- Tiered retention: recent data hot and searchable; older logs in object storage, rehydrated on demand; downsampled metrics for long-term trends.
- Drop unused metrics: many exporters emit hundreds of metrics; keep the ones dashboards and alerts use (
write_relabel_configs, Day 14). - Budgets per team: show each team its own usage, with quotas or alerts on sudden growth. Visibility alone changes behavior.
- Guard rails in code review and CI: cardinality checks on new labels, lint rules for logging in hot paths.
What not to cut
- Errors, slow requests and audit logs.
- RED metrics for every service (Day 6) and SLO data (Day 22).
- Recent data at full resolution for incident investigation.
Cutting these saves little and costs a lot during the next incident. The goal is spending on signals people use, not the lowest possible bill.
Check yourself
The number of active time series; query series counts per metric with topk(count by (__name__) (...)) or the TSDB status page.
Data dropped before ingestion is never billed for ingestion, indexing or storage, and never travels across the network. Filtering in the backend usually means you've already paid for most of it.
Errors and slow requests, RED and SLO metrics, audit and security logs, and recent full-resolution data for investigations. Those are what you'll need in the next incident.
Tag telemetry with service and team attributes and report volume and cost per team, so the people who create the data see its cost.
Dropping debug logs and health check noise at the collector, and setting shorter retention for verbose logs that are rarely queried. These cut volume substantially without touching the error and audit data investigations depend on.