Building an Observability Culture
On this page
Why culture matters more than tools
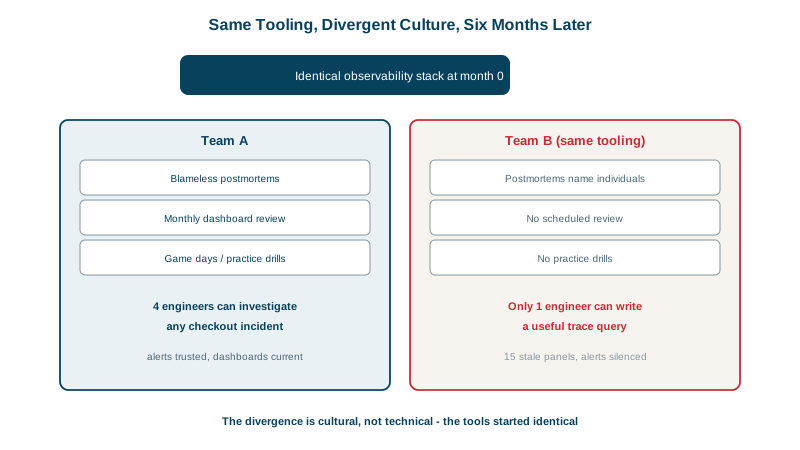
Two teams run identical stacks: Prometheus, OpenTelemetry, Grafana. In one, a single senior engineer can debug production; everyone else waits. Dashboards describe last year's architecture. Alerts are muted. In the other, any engineer on call can follow an alert to a cause in minutes, and the telemetry keeps up with the system. The difference isn't tooling. It's habits.
Practices that spread observability across a team
- Instrumentation is part of "done." A feature isn't finished until its logs, metrics and spans exist and its dashboard panel is updated. Review instrumentation in pull requests like tests.
- Developers own their services in production, including on-call (with support and reasonable load). People instrument what they'll be paged for.
- Shared, paved-road defaults: a service template that already has structured logging, RED metrics, tracing and an SLO skeleton (Day 27). The easy path is the observable path.
- Observe during development: use traces in local and staging environments to understand new code, not just to debug outages.
- SLOs agreed with product: error budgets turn reliability into a shared, measurable goal rather than an ops concern (Day 22).
Learning loops: postmortems and game days
- Blameless postmortems that ask "what telemetry would have shown this sooner?" and turn the answer into an action item (see the CI/CD course).
- Game days: deliberately inject a failure (slow dependency, full pool, bad deploy) and have someone who didn't design the system investigate it with only the telemetry. Gaps show up fast.
- Rotate investigation roles so knowledge doesn't stay with one person.
- Review alerts and dashboards regularly: delete what nobody uses, fix what misled people.
- Share good investigations: a short write-up or demo of how a tricky issue was found teaches more than documentation.
Observability anti-patterns
| Anti-pattern | Better |
|---|---|
| A central team owns all dashboards and alerts | Teams own theirs; a platform team provides tools and defaults |
| "Monitoring is ops' job" | Developers instrument and are on call for what they build |
| Alerts muted rather than fixed | Every noisy alert gets tuned or deleted within a week |
| Dashboards nobody maintains | Dashboards as code, reviewed after incidents |
| Telemetry collected "just in case" | Signals tied to questions people ask, with costs visible |
| Heroes who debug everything | Runbooks, pairing during incidents, game days |
Measuring observability progress
- Time to detect and time to resolve incidents, trending over months.
- How often incidents are found by alerts versus customers.
- Number of people who can lead an investigation for each service.
- Alert quality: share of pages that were actionable.
Where this course leaves you
You can choose what to measure (RED, USE, SLIs), produce good telemetry (structured logs, bounded metrics, traces with propagation through OpenTelemetry), store and query it (Prometheus, PromQL, long-term storage, sampling), correlate it (exemplars, trace IDs, service maps), act on it (burn-rate alerts, routing, on-call) and investigate with it, while keeping costs under control. The last step is making all of that normal for your team.
Check yourself
Telemetry is then built alongside the code, reviewed with it and kept current as it changes. Added later, it usually arrives only after an outage reveals the gap, when it's too late to help with that incident.
Whether the telemetry and alerts let someone unfamiliar with the system detect and diagnose a failure, exposing gaps before a real incident.
Only one or two engineers can lead investigations, and incidents stall when they're on holiday. Others don't know where the dashboards are or how to query traces.
Pair less experienced engineers with experienced ones during incidents, rotate who leads investigations, run game days, and review telemetry in code review. Skills spread through practice, not documentation alone.
Track time to detect and diagnose incidents, the share of incidents found by alerts before users, and coverage of services with SLOs and tracing.