SLO-Based Alerting: Actionable Alerts
On this page
From threshold alerts to error budget alerts
"Error rate above 1% for 5 minutes" sounds reasonable, but it pages for short blips that barely touch the error budget, and stays quiet for a slow 0.5% leak that burns the whole month's budget in days. With an SLO (Day 22), the question becomes: is the error budget being spent fast enough that a human must act?
What is burn rate?
Burn rate is how fast you're spending the budget relative to the SLO:
- Burn rate 1: errors at exactly the budgeted rate (0.1% for a 99.9% SLO); the budget lasts the whole window.
- Burn rate 14.4: 1.44% errors; 2% of a 30-day budget is gone in one hour, and the whole budget in about two days.
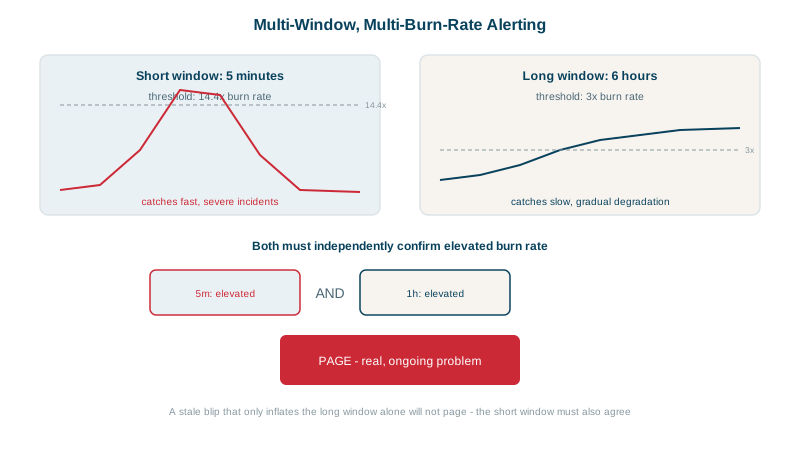
The Google SRE Workbook recommends paging on fast burns (like 14.4× over 1 hour) and ticketing slow burns (like 1× over 3 days).
A multi-window burn-rate alert in Prometheus
Use a long window to measure significance and a short one to confirm it's still happening. This rule file passes promtool check rules:
groups:
  - name: checkout-slo-burn
    rules:
      - record: checkout:error_ratio:rate5m
        expr: sum(rate(http_requests_total{route="/checkout", status=~"5.."}[5m])) / sum(rate(http_requests_total{route="/checkout"}[5m]))
      - record: checkout:error_ratio:rate1h
        expr: sum(rate(http_requests_total{route="/checkout", status=~"5.."}[1h])) / sum(rate(http_requests_total{route="/checkout"}[1h]))

      # Page: budget burning 14.4x faster than sustainable, confirmed on both windows
      - alert: CheckoutErrorBudgetFastBurn
        expr: checkout:error_ratio:rate1h > (14.4 * 0.001) and checkout:error_ratio:rate5m > (14.4 * 0.001)
        labels:
          severity: page
        annotations:
          summary: "Checkout is burning its error budget fast ({{ $value | humanizePercentage }} errors)"
          runbook_url: "https://runbooks.example.com/checkout/error-budget"
The 5-minute window also makes the alert resolve quickly once the problem is fixed, instead of staying red for an hour while the long window drains.
Testing a burn-rate alert with promtool
A promtool unit test feeds 1,000 requests per minute: errors at 0.05% for an hour, then 3%:
- series: 'http_requests_total{route="/checkout", status="200"}'
  values: '0+1000x59 59970+970x60'
- series: 'http_requests_total{route="/checkout", status="503"}'
  values: '0+0.5x59 29.5+30x60'
Checking minute by minute when it first fires:
minute 63: no alert     (5m window already high; 1h window not yet)
minute 85: no alert
minute 87: no alert
minute 88: ALERT
It pages 28 minutes after a 3% incident starts. That's not a bug; it follows from the design. Detection time = window × burn-rate threshold ÷ actual burn rate: 60 min × 14.4 ÷ 30 ≈ 29 minutes. A full outage (100% errors, burn rate 1,000) would page in under a minute. At the moment it fired, $value (the 1-hour ratio) was 1.55%, still climbing toward 3%, which the test also checks. A second test case confirmed that a two-minute burst of errors doesn't page at all.
Tuning burn-rate alerts for your service
- Add a second, slower tier for medium burns, such as 6× over 6 hours confirmed by 30 minutes, as a page or high-priority ticket, and a 1× over 3 days ticket.
- Low traffic makes ratios noisy: one failure out of ten requests is a 10% error rate. Require a minimum request count, or use longer windows.
- Latency SLOs work the same way with "fraction of requests slower than X" as the error ratio.
- Tools generate these rules for you from an SLO definition: Sloth, Pyrra, OpenSLO-based tools, and most commercial platforms.
Check yourself
The budget is being spent 14.4 times faster than sustainable: 2% of it per hour, all of it in about two days.
The long window shows the burn is significant; the short one confirms it's still happening, and lets the alert clear soon after recovery.
The 1-hour error ratio had to climb above 1.44%, which takes about 60 × 14.4 ÷ 30 ≈ 29 minutes at a burn rate of 30.
A 6-hour window at a lower burn rate catches slow, steady budget loss that never trips the fast alert, often as a ticket rather than a page.
They scale with the SLO and traffic, page only when the budget is genuinely at risk, and tell responders how urgent the problem is.