Long-Term Metrics Storage and Downsampling
On this page
Why Prometheus needs long-term storage
"How does this Black Friday compare to last year's?" "What's our 13-month traffic trend for capacity planning?" "Show p99 across all 12 clusters." A single Prometheus server keeps local data for a configured retention (15 days by default), for its own targets only, and if its disk dies, the history goes with it.
Prometheus remote write, validated
Prometheus (or an agent) can stream every sample to a remote backend as it's scraped. This config passes promtool check config:
global:
  scrape_interval: 30s
  external_labels:
    cluster: prod-us-east-1      # identifies where data came from in the global store
    replica: prometheus-a        # lets the backend deduplicate HA pairs
remote_write:
  - url: http://mimir-distributor:8080/api/v1/push
    queue_config:
      max_samples_per_send: 2000
    write_relabel_configs:
      - source_labels: [__name__]
        regex: "go_.*|process_.*"
action: drop # don't pay to store runtime internals centrally- External labels are essential: without
cluster, series from different clusters collide in the central store. write_relabel_configsfilters what leaves the cluster, the simplest cost control.- Keep local retention short (
--storage.tsdb.retention.time=15d) for fast local queries and alerting.
Thanos vs Mimir vs VictoriaMetrics vs managed services
| System | Model | Notes |
|---|---|---|
| Thanos | Sidecar uploads Prometheus blocks to object storage; a query layer merges stores | Builds on existing Prometheus servers; object storage (S3, GCS) is cheap |
| Grafana Mimir (or Cortex) | Receives remote write; horizontally scalable, multi-tenant | Common for large, shared platforms; also behind Grafana Cloud |
| VictoriaMetrics | Single binary or cluster; receives remote write | Known for low resource use |
| Managed services | Amazon Managed Service for Prometheus, Google Cloud Managed Service for Prometheus, Grafana Cloud | No operations; pay per sample and series |
All of them accept PromQL, so dashboards and alerts keep working.
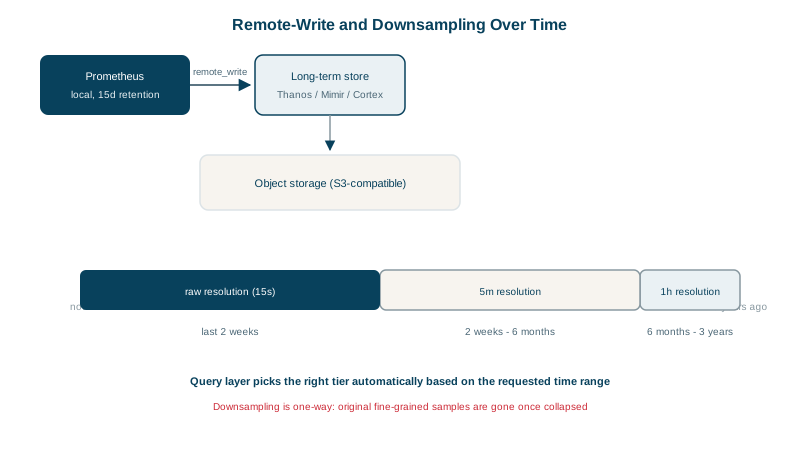
Downsampling old metrics data
Raw data at a 15-second resolution is 5,760 samples per series per day. For a year-old trend, one point every hour is plenty. Downsampling stores lower-resolution versions of old data (Thanos, for example, creates 5-minute and 1-hour resolutions and keeps each for its own retention period), cutting storage and making long-range queries fast.
A typical policy:
| Age | Resolution | Used for |
|---|---|---|
| 0 to 15 days | Raw (15 s) | Incidents, alerting, debugging |
| 15 days to 3 months | 5 minutes | Recent trends, post-incident analysis |
| 3 months to 2 years | 1 hour | Capacity planning, year-over-year comparison |
Downsampled data keeps aggregates (min, max, sum, count) for each period, so rates and averages stay correct, but short spikes and exact percentiles from that period are gone. Decide what you need at full resolution before you need it.
Cost control for long-term metrics
- Send only what's queried centrally; keep detailed runtime metrics local.
- Use recording rules to precompute aggregates (per service rather than per pod) and store those long-term instead of every raw series.
- Watch active series per tenant or team, and set limits (Mimir and others enforce per-tenant limits).
Check yourself
Without labels like cluster and replica, identical series from different Prometheus servers collide or can't be deduplicated in the central store.
Short spikes and fine detail within each period. A 30-second spike becomes part of a 5-minute or 1-hour aggregate, though storing min, max, sum and count per period preserves the extremes and averages.
Local storage serves fast recent queries and alerting, which only need hours or days. Long history lives cheaply and durably in the remote store, often on object storage, so local disks stay small.
Thanos adds sidecars to Prometheus servers and queries their data plus object storage; Mimir receives remote write into a horizontally scalable, multi-tenant cluster.
Recent raw data supports detailed investigations, while downsampled data is enough for long-term trends at a fraction of the cost.