What Is Distributed Tracing and Why You Need It
On this page
Why logs alone can't debug multi-service requests
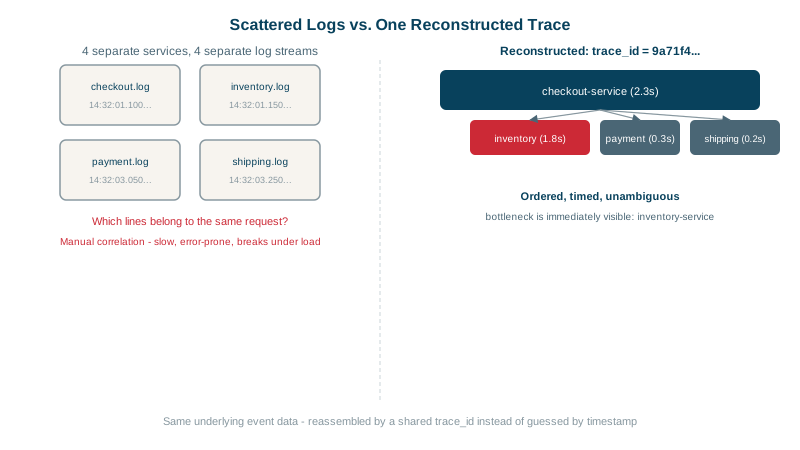
A checkout takes 2.3 seconds instead of 300 ms. It touches checkout, inventory, payment and shipping services. Without tracing, you open four log streams:
checkout-service.log   14:32:01.100 "calling inventory-service"
inventory-service.log  14:32:01.150 "lookup started"     <- is this the same request?
inventory-service.log  14:32:02.900 "lookup finished"    <- or this one?
payment-service.log    14:32:03.050 "charge started"
At thousands of requests a second, lines from different requests interleave. Clocks on different hosts disagree by milliseconds. You're guessing which lines belong together, and guessing which call was slow. This is why you need distributed tracing once requests cross more than a couple of services.
What is a distributed trace?
Think of parcel tracking: one tracking number, and a list of every depot the parcel passed through with the time it arrived and left. A distributed trace does the same for a request, recording its whole journey as a tree of spans. Each span is one operation (an incoming request, an outgoing call, a database query, a function you chose to time), with a start time, duration, status and attributes, and a pointer to its parent.
A real trace from this course's lab, where an instrumented checkout service calls an inventory service and then does a payment step:
trace 7ef871bcd8a4c5fbaad54c198c646ffc
checkout   POST                                  233 ms
  checkout   request handler - /checkout         232 ms
    checkout   GET  (call to inventory)          133 ms
      inventory  GET                             125 ms
        inventory  request handler - /inventory/:sku  124 ms
    checkout   charge_card                        81 ms
At a glance: the request took 233 ms, the inventory call was 133 ms of it (125 ms spent inside inventory), and the payment step took 81 ms. No timestamps to match, no guessing; every span carries the same trace ID across both services.
What traces answer that metrics and logs can't
- Where did the time go? Critical path and self time (Day 21).
- Which dependency failed? Errors are marked on the exact span.
- What did this specific slow request do? Including retries, fan-out and repeated calls (N+1 database queries show up as a comb of identical spans).
- How do services depend on each other? Aggregated traces produce service maps (Day 20).
What distributed tracing takes: instrumentation, propagation, a backend
- Instrumentation creates spans: auto-instrumentation for HTTP servers and clients, databases and queues, plus manual spans for important business steps (Day 17).
- Context propagation passes the trace ID and parent span ID between services, usually in the W3C
traceparentheader (Day 16). - A pipeline and backend collects, samples and stores spans: the OpenTelemetry Collector with Jaeger, Grafana Tempo, Zipkin, or a commercial tool (Day 18).
One service that doesn't propagate context breaks the trace into disconnected pieces, so coverage matters more than depth at first.
Check yourself
Lines from concurrent requests interleave and host clocks differ, so you can't tell which lines belong to the same request.
One timed operation in a trace, with a name, start and duration, status, attributes, and a link to its parent span.
The trace breaks into separate pieces: the downstream work starts a new trace, no longer appears under the original request, and the slowest part of a request may be exactly the part you can't see.
Instrumentation in each service to create spans, context propagation so every service joins the same trace, and a backend to store and search traces. Missing any one breaks it: a single service that doesn't propagate context splits traces apart.
Where time went for a slow request, which downstream call failed, and how a request flowed through services, queues and databases.