Correlating Traces, Logs and Metrics
On this page
Why correlate metrics, traces and logs
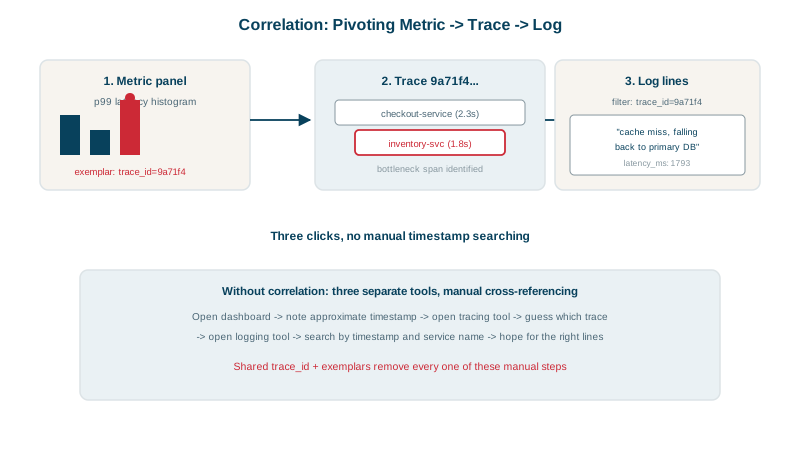
Metrics show a latency spike. Somewhere in your trace backend is a trace of a slow request, and somewhere in your log store are the lines explaining it. Without links between them, you search each by time range and guess. With links, it's three clicks.
Exemplars: linking metrics to traces
An exemplar attaches a trace ID to a sample in a histogram bucket, without adding a label (so no cardinality cost, Day 7). With prom-client, using the OpenMetrics format:
register.setContentType(client.Registry.OPENMETRICS_CONTENT_TYPE);
const h = new client.Histogram({ name: 'http_request_duration_seconds', help: 'Request duration',
  labelNames: ['route'], buckets: [0.1, 0.5, 2.5], enableExemplars: true, registers: [register] });

h.observe({ labels: { route: '/checkout' }, value: 2.31,
            exemplarLabels: { trace_id: '9a71f4b2c3d4e5f6a7b8c9d0e1f2a3b4' } });
The exposed metrics:
http_request_duration_seconds_bucket{le="0.1",route="/checkout"} 1 # {trace_id="4bf92f3577b34da6a3ce929d0e0e4736"} 0.08 1791738146.009
http_request_duration_seconds_bucket{le="2.5",route="/checkout"} 2 # {trace_id="9a71f4b2c3d4e5f6a7b8c9d0e1f2a3b4"} 2.31 1791738146.009
The 2.31-second request's trace ID rides along with the bucket it landed in. Prometheus stores exemplars when started with --enable-feature=exemplar-storage and scraping OpenMetrics; Grafana shows them as dots on latency graphs, and clicking one opens the trace. The OpenTelemetry SDK attaches exemplars from the active span automatically.
Trace IDs in logs: linking traces to logs
Put trace_id and span_id on every log line written during a request. OpenTelemetry's logger instrumentations (pino, winston, bunyan in Node; logging libraries in Java, Python and .NET) do it automatically. A warning logged inside a span:
{"level":40,"time":1791738138125,"service":"checkout","trace_id":"dbcfe4e6bc3f4a74453ba045f415ae1a",
 "span_id":"f57c98335d8a34af","trace_flags":"01","event":"gateway_retry","attempt":2,"msg":"retrying payment gateway"}
Now the trace view can show "logs for this span", and a log search can open the trace.
A gotcha found while testing: when the test script loaded pino with an ESM import, log lines came out without trace_id, even with the OpenTelemetry register entry point and loader hook enabled. The automatic injection patches modules loaded through require; loaded that way, the IDs appeared. A dependable alternative that works however the logger is loaded is a pino mixin reading the active span:
import pino from 'pino';
import { trace } from '@opentelemetry/api';

const logger = pino({
  mixin() {
    const ctx = trace.getActiveSpan()?.spanContext();
    return ctx ? { trace_id: ctx.traceId, span_id: ctx.spanId } : {};
  },
});{"level":40,"trace_id":"d14bdf7f4ed874b66eaf53e26cf04e99","span_id":"aa20348cc4af1863","event":"gateway_retry","msg":"retrying"}
{"level":30,"msg":"outside any span"}Inside a span, the IDs are added; outside, nothing. If your logs lack trace IDs, check how the logger is loaded, and test it before an incident does.
Shared resource attributes across all signals
Use the same resource attributes on all three signals:
service.name,service.version,deployment.environment.name,k8s.pod.nameorhost.name.
Then a dashboard filtered to service.name=checkout, service.version=1.42.0 can open matching traces and logs with the same filter.
The investigation path from metric to log
- Metric alert or graph shows the problem and when it started.
- Exemplar on the slow bucket opens a representative trace.
- Trace shows the slow or failing span (Day 21).
- Logs for that span, by trace ID, explain why.
- Back to metrics to measure how many requests share the cause (filter by the attribute you found).
Check yourself
A trace ID and value attached to a bucket sample; it's metadata on the sample, not a label, so no new series are created.
So you can jump from a trace to exactly the logs written during it, and from a log line to its full trace.
Whether the logging library is loaded in a way the instrumentation can patch (ESM imports weren't, in testing); otherwise add trace IDs yourself with a logger mixin that reads the active span.
Metrics, traces and logs then use the same names for the same service, environment and version, so tools can jump between them reliably.
An alert on a metric, an exemplar or query to find example traces, the slow span in a trace, then the logs for that trace id to see the error details.