How to Instrument a Service from Scratch
On this page
- Instrument a new service from day one
- Step 1: structured logs with context
- Step 2: RED metrics in Express middleware
- Step 3: tracing with OpenTelemetry
- Step 4: metrics for dependencies and resources
- Step 5: SLOs, alerts and a dashboard
- Observability production readiness checklist
- Testing your instrumentation
- Check yourself
Instrument a new service from day one
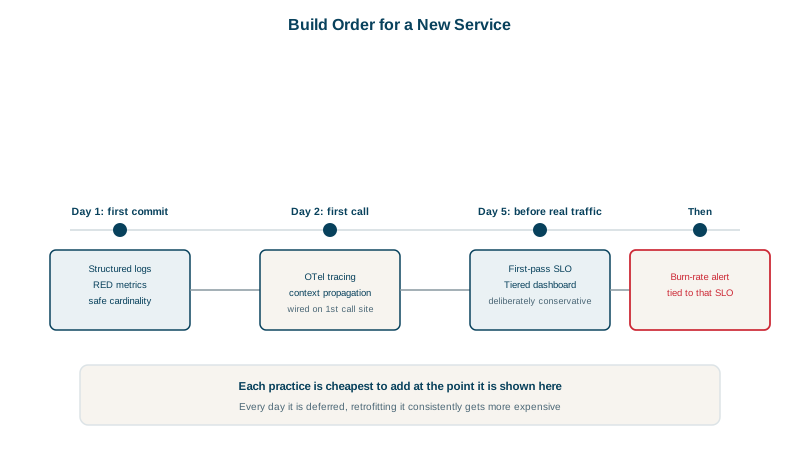
Instrumentation added after the first outage is always incomplete. Added at the start, it costs a few hours and shapes how the service is built. Here's the order that gives the most value first, using the checkout service from this course's lab.
Step 1: structured logs with context
import pino from 'pino';
const logger = pino({ base: { service: 'checkout', version: process.env.APP_VERSION } });
One JSON line per significant event, stable event names, no secrets, and trace IDs added through instrumentation or a mixin (Days 3 and 19).
Step 2: RED metrics in Express middleware
One middleware covers every endpoint:
app.use((req, res, next) => {
  const end = duration.startTimer();
  res.on('finish', () => {
    const route = req.route?.path ?? 'unmatched';       // route template, never the raw URL
    end({ route });
    requests.inc({ route, method: req.method, status: String(res.statusCode) });
  });
  next();
});
app.get('/metrics', async (_req, res) => res.type(register.contentType).send(await register.metrics()));
Rate, errors and a latency histogram for every route, with bounded labels (Days 5 to 7). Choose histogram buckets around the latency target (Day 10).
Step 3: tracing with OpenTelemetry
Load the SDK before the app, with auto-instrumentation, and add manual spans for business steps:
SERVICE_NAME=checkout node --import ./tracing.mjs app.mjsawait tracer.startActiveSpan('charge_card', async (span) => {
span.setAttribute('payment.provider', provider);
// ...
span.end();
});In the lab, this gave connected traces across services, with the traceparent header propagated automatically (Days 16 and 17).
Step 4: metrics for dependencies and resources
Instrument the things that will saturate: connection pools, queues, caches, external API clients. Utilization, saturation and errors for each (USE, Day 6), plus client spans and metrics for every dependency.
Step 5: SLOs, alerts and a dashboard
- Define one or two SLIs for the main user journey (Day 22).
- Add a multi-window burn-rate alert, with a promtool test (Day 23), routed to the owning team (Day 24) with a runbook.
- A dashboard with RED per route, dependencies, saturation and deploy markers (Day 12).
Observability production readiness checklist
[ ] Structured JSON logs with service, version, environment and trace IDs; no secrets
[ ] RED metrics per route with bounded labels; histogram buckets around the SLO threshold
[ ] Traces with propagation across every inbound and outbound call, including queues
[ ] Metrics and spans for every dependency (DB pool, cache, external APIs)
[ ] Resource attributes consistent across logs, metrics and traces
[ ] SLO defined, burn-rate alerts tested with promtool, routed to the owning team
[ ] Runbook linked from every paging alert
[ ] Dashboard with deploy markers, linked from alerts
[ ] Health and readiness endpoints, excluded from logs and traces
[ ] Sampling and retention configured; cardinality reviewed
Testing your instrumentation
- Break things on purpose in staging: kill a dependency, add latency, fill a pool. Did the alert fire? Could you find the cause from the telemetry alone?
- Check a trace end to end after every new integration.
- Watch series counts after deploys that change labels.
Check yourself
Every endpoint is covered consistently, including new ones, with no chance of a developer forgetting one, and labels and buckets stay uniform across the service.
The raw URL contains ids, like /orders/482, and creates unbounded cardinality. The template, /orders/:id, has a small fixed set of values and groups requests meaningfully.
Inject failures in staging, such as a slow dependency or failing database, and check that alerts fire, dashboards show the problem and traces and logs lead you to the cause.
Structured logs with trace ids, RED metrics, tracing with propagation, dependency metrics, SLOs with burn-rate alerts, a dashboard and a runbook.
Metrics per downstream service, with latency and errors, show at a glance whether slowness comes from your own code or from a database or API you call, without opening traces. That shortens the first minutes of an incident.