Root Cause Analysis with Metrics, Logs and Traces
On this page
A repeatable method for root cause analysis
Under pressure, people jump to the theory that worked last time. A repeatable sequence (detect, scope, localize, explain, confirm) finds the real cause faster and keeps a team aligned during an incident.
Example incident: checkout errors at 12%
At 14:32 the page arrives: CheckoutErrorBudgetFastBurn, checkout errors at 12%.
1. Scope with metrics. Which requests, since when, and what changed?
sum by (route, status) (rate(http_requests_total{service="checkout", status=~"5.."}[5m]))Only /checkout is failing, with 503s, starting at 14:30. The deploy annotation on the dashboard shows a release at 14:12, eighteen minutes before the errors started. Breaking errors down by version shows both old and new pods failing equally. So probably not the deploy. Note it and move on.
2. Localize with traces. Click an exemplar on the error-rate panel (Day 19) and walk self time down the failing trace (Day 21):
checkout-service            total 2.30 s   self 0.05 s   status ERROR
  inventory-service         total 0.12 s   self 0.12 s
  payment-service           total 2.20 s   self 0.10 s   status ERROR
    POST acme-pay /charges  total 2.10 s                  status ERROR  (timeout after 3 retries)
Payment's call to the external gateway times out. Ten more failing traces show the same pattern. The service map (Day 20) agrees: the payment -> acme-pay edge is red.
3. Explain with logs. Filter payment's logs by one failing trace ID:
{"level":"warn","service":"payment","trace_id":"9a71f4...","event":"gateway_retry","attempt":3,
 "gateway":"acme-pay","error":"connect ETIMEDOUT","pool_active":50,"pool_max":50}
The connection pool to the gateway is full (50 of 50). Requests wait for a connection, time out, retry, and the retries take even more connections.
4. Confirm with metrics again. Is this the cause for all failures, or one of several?
max by (instance) (payment_gateway_pool_active / payment_gateway_pool_max)Every payment instance has been at 100% since 14:29, and the gateway's own latency (from client spans) rose from 200 ms to 1.8 s at 14:28. The gateway slowed down; our pool and retry settings turned a slowdown into an outage.
Mitigate first, then investigate
At step 2 the team already knew enough to mitigate: reduce retries and enable the payment fallback (queue charges for later). Restore service first; the full explanation can follow (see the CI/CD course on incident response).
Investigation habits that prevent wrong turns
- Look for what changed: deploys, config, feature flags, traffic shape, dependencies. Then test that theory rather than assuming it, as the version breakdown did.
- Compare good and bad: failing versus succeeding requests, affected versus unaffected instances, today versus last week.
- Confirm the theory explains the whole picture: the timing, the scope, and why it stopped (or didn't).
- Write the timeline as you go, so the postmortem has facts, not memories.
- Look for contributing factors, not one root cause: the gateway slowed, the pool was small, retries had no budget, and there was no circuit breaker. Each becomes a follow-up action.
Check yourself
To test whether the new version is responsible; if old and new versions fail equally, the deploy probably isn't the cause.
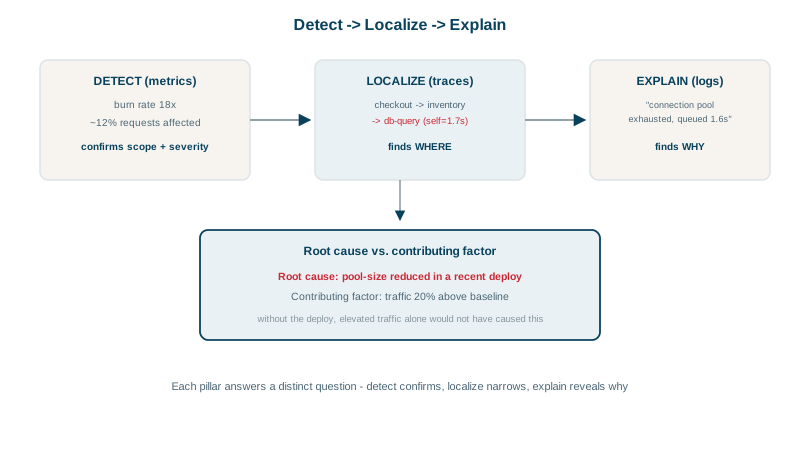
Metrics scoped the problem and confirmed the theory, traces localized it to the gateway call, and logs explained it with the exhausted pool.
Users are affected now. Mitigation, such as a rollback, failover or disabling a feature, restores service, and the investigation can continue calmly afterwards without that pressure.
Fixating on the first anomaly found, such as a CPU spike, without checking whether it actually lines up with the user impact in time and scope.
It keeps the team from retesting the same ideas, records what was ruled out, and gives the postmortem an accurate timeline.