SLI, SLO and Error Budgets Explained
On this page
Why reliability needs a definition
Product wants faster releases; operations wants fewer incidents. Without a shared definition of "reliable enough", every outage becomes an argument. Service level objectives, from Google's Site Reliability Engineering practice, give that definition.
SLI vs SLO vs SLA vs error budget
- SLI (service level indicator): a measurement of user experience, as a ratio of good events to valid events. "The proportion of checkout requests that succeed and complete in under 500 ms." If 9,994 of 10,000 checkouts did that today, the SLI is 99.94%.
- SLO (service level objective): a target for the SLI over a time window. "99.9% over 28 days."
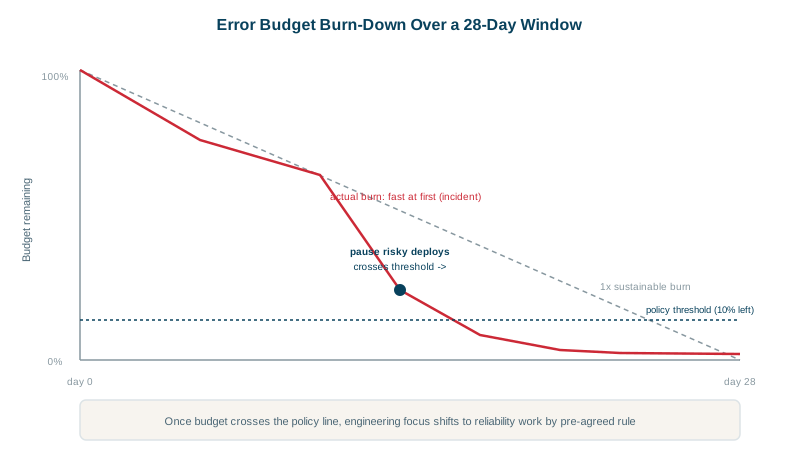
- Error budget: what's left over: 100% minus the SLO. 0.1% of requests may fail or be slow.
- SLA (service level agreement): a contract with customers, with penalties. Set SLAs looser than SLOs, so you have warning before a breach costs money.
How to choose good SLIs
Measure what users feel, as close to them as practical (load balancer or client, rather than deep inside one service):
| Service type | Typical SLIs |
|---|---|
| Request/response APIs | Availability (non-5xx responses), latency (fraction under a threshold) |
| Data pipelines | Freshness (data updated within N minutes), correctness |
| Storage | Durability, read and write latency |
| Batch jobs | Completed successfully by their deadline |
Define latency SLIs as "fraction of requests faster than X", which is exact from histogram buckets placed at X (Day 10), rather than "p99 below X".
As a PromQL ratio, assuming a bucket boundary at 0.5 seconds:
# good events / valid events over the window
sum(rate(http_request_duration_seconds_bucket{route="/checkout", le="0.5"}[28d]))
/
sum(rate(http_request_duration_seconds_count{route="/checkout"}[28d]))
In the course lab, the same query with a 250 ms threshold returned 0.6045: only 60% of checkouts finished under 250 ms, far from any reasonable target, because one instance was deliberately slow.
How to set SLO targets
- Start from what users need and what you achieve today, not from "five nines". If the service runs at 99.95%, a 99.99% target means constant alerts; a 99.9% target is realistic and still meaningful.
- Each nine costs much more than the last: more redundancy, slower releases, more on-call effort.
- Dependencies cap you: a service can't be more available than the critical dependencies it calls synchronously.
- Revisit quarterly as you learn.
Error budget arithmetic
For 99.9% over 30 days:
| Measure | Allowed |
|---|---|
| Time-based | 0.1% of 43,200 minutes = 43.2 minutes of total unavailability |
| Request-based, at 10 million requests | 10,000 failed or slow requests |
Request-based budgets are usually fairer: an outage at 3 a.m. with little traffic costs less budget than one at peak.
Using the error budget to balance speed and reliability
The budget turns arguments into policy, agreed in advance:
- Budget healthy: ship features, run experiments, do risky migrations.
- Budget burning fast: alert (Day 23).
- Budget exhausted: pause risky releases and spend engineering time on reliability until it recovers. Exceptions for security fixes.
The SLO also protects against over-investing: if you're consistently far above target, you can move faster.
Check yourself
An SLO is an internal reliability target; an SLA is a customer contract with penalties, usually set looser than the SLO.
About 43.2 minutes. Thirty days is 43,200 minutes, and 0.1 percent of that is 43.2. At 99.99 percent it drops to about 4.3 minutes.
It's a ratio of good events to all events, which can be measured exactly from histogram buckets and plugs directly into an error budget. "p99 under X" is an estimate that can't be summed over time or turned into a budget cleanly.
It measures what users experience, such as successful requests or requests under a latency threshold, as a ratio of good events to valid events.
It's impossible and extremely expensive to approach, and users can't tell the difference beyond a point because their own networks fail more often.