Service Maps and Dependency Graphs
On this page
Why architecture diagrams go stale
The architecture diagram on the wiki shows eight services. Production has fourteen: someone added a fraud-scoring call last quarter, the recommendation service started calling a new feature store, and an old reporting job still queries the orders database directly. Service maps are drawn from what the system does, not what someone remembered to document.
How service maps are built from traces
Every client span records who called whom: a span from checkout with kind CLIENT, followed by a SERVER span in inventory with the same trace. Aggregating millions of these pairs gives a graph:
- Nodes: services, plus databases, caches, queues and external APIs (from database and messaging span attributes like
db.system.nameandserver.address). - Edges: calls between them, annotated with request rate, error rate and latency.
Jaeger, Grafana Tempo's service graph, Datadog, Honeycomb, New Relic and AWS X-Ray all build these. In OpenTelemetry, the collector's servicegraph connector can turn spans into edge metrics that Prometheus stores. Service meshes (Istio, Linkerd) can draw similar maps from network traffic without application instrumentation.
Reading a service map during an incident
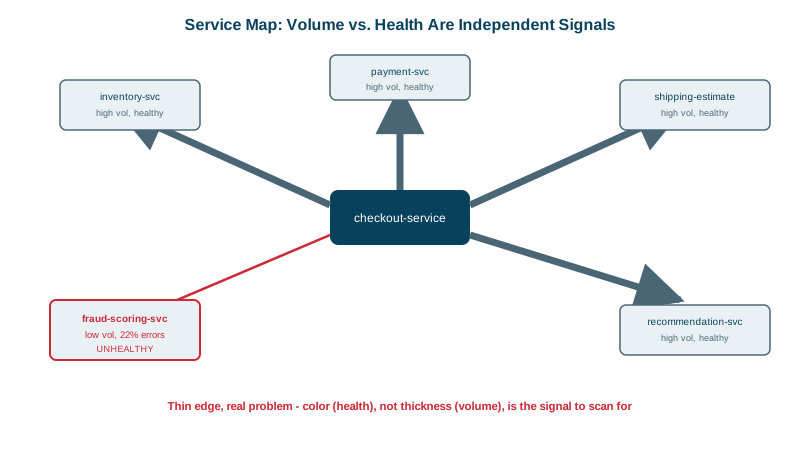
Checkout errors are up. The map's edges from checkout:
checkout -> inventory           rate high   errors 0.1%   p99  45 ms   healthy
checkout -> payment             rate high   errors 0.2%   p99 310 ms   healthy
checkout -> shipping-estimate   rate high   errors 0.1%   p99  60 ms   healthy
checkout -> recommendations     rate high   errors 0.3%   p99  90 ms   healthy
checkout -> fraud-scoring       rate low    errors 22%    p99 4.8 s    UNHEALTHY
One edge stands out: the low-volume fraud-scoring call fails 22% of the time and takes nearly five seconds at p99. The checkout service's own metrics only said "errors are up"; the map points at the dependency. And if checkout calls fraud-scoring synchronously with no timeout, that one slow dependency can consume checkout's capacity (see the distributed systems course on cascading failures).
What service maps are good for
- Incident triage: which edge is red?
- Blast radius: what depends on the service you're about to change or take down?
- Finding surprises: unexpected dependencies, cycles, services calling a database they shouldn't, chatty call patterns.
- Ownership and documentation: an always-current picture, often linked to a service catalog (Backstage, Cortex).
Service map blind spots
- Uninstrumented services show up only as the client side of calls, or not at all.
- Asynchronous flows through queues need producer and consumer spans with context propagation to appear as edges (Day 16).
- Sampling (Day 18) can hide low-volume edges entirely; build edge metrics from all spans before sampling, as the collector connector does.
- Shared infrastructure (one database cluster for many services) can look like one node when it's several.
Check yourself
Aggregated trace spans: client and server spans show which service called which, and the map adds request rates, error rates and latency on each edge. It reflects real traffic, not a hand-drawn diagram.
With low volume and aggressive sampling, few or none of its spans may be kept, so its edge never appears on the map. Maps built from unsampled span metrics, or sampling rules that keep rare paths, avoid that blind spot.
It shows every service that calls the one you're changing, based on real traffic, so you know the blast radius and which teams to notify. Documentation often misses callers that the map reveals.
Uninstrumented services, calls through components that don't propagate context, such as some queues and proxies, and dependencies that only appear in rare code paths, like a yearly batch job. Treat the map as strong evidence, not a complete inventory.
It shows which services are red and how they connect, so you can follow errors to the deepest failing dependency.