Structured Logging Explained with Examples
On this page
Why plain-text logs don't scale
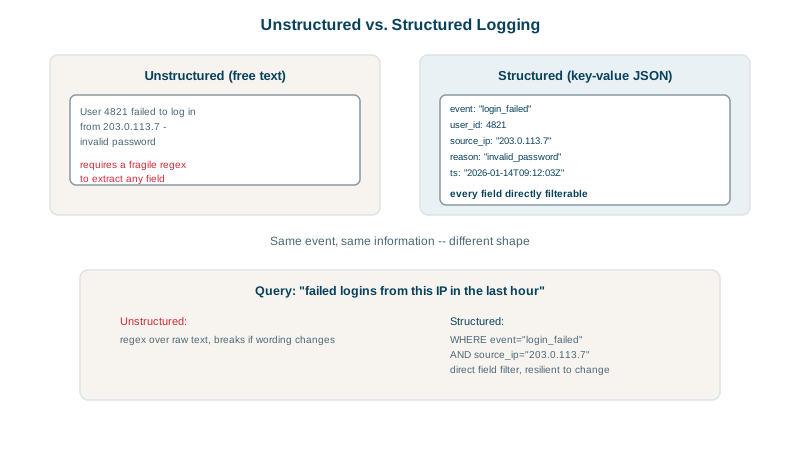
console.log(`Order ${orderId} failed for customer ${customerId} (tier: ${tier}): payment gateway timeout after ${elapsedMs}ms`);That line is fine for a human reading one file. At 50 servers and millions of lines, questions like "how many gateway timeouts per tier in the last hour?" need regular expressions that break whenever someone rewords the message.
What is structured logging?
A structured log is a set of named fields, usually JSON, one event per line. The service from this course's lab logs failures with pino:
logger.error({ event: 'request_failed', route, method, status, duration_ms, order_id, error: 'payment_gateway_timeout' });And emits:
{"level":50,"time":1791737542554,"service":"checkout","instance":"checkout-9101",
 "event":"request_failed","route":"/orders/:id/checkout","method":"POST","status":503,
 "duration_ms":33,"order_id":"28689","error":"payment_gateway_timeout"}
Now "failures by error type and route in the last hour" is a filter and a group-by in any log platform (Loki, Elasticsearch, CloudWatch Logs Insights, Datadog), with no parsing. The service and instance fields come from the logger's base configuration, so every line carries them without anyone remembering to add them.
Fields to include on every log line
| Field | Why |
|---|---|
timestamp (UTC, ISO 8601 or epoch ms) | Ordering and correlation across services |
level | Filtering by severity (Day 4) |
service, version, environment, instance | Which deploy of what, where |
event | A stable, machine-friendly name (order_failed), not a sentence |
trace_id, span_id | Jumping from a log to its trace (Day 19) |
request_id, user_id or tenant_id | Following one request or one customer |
error.type, error.message, error.stack | Grouping failures by kind |
OpenTelemetry's semantic conventions give standard names for many of these, so tools understand them without configuration.
Structured logging best practices
- Stable event names and field names. Treat them like an API: dashboards and alerts depend on them. Rename and you break queries.
- Consistent types:
duration_msis always a number in milliseconds, never"33ms". - Log context once: attach request-scoped fields (trace ID, user) to a child logger at the start of the request, rather than passing them to every call. With pino:
const log = logger.child({ request_id: 'req_8f2a91', user_id: 'u_42' });   // once per request
log.info({ event: 'cart_loaded', items: 3 });
log.warn({ event: 'gateway_retry', attempt: 2 });{"level":30,"service":"checkout","request_id":"req_8f2a91","user_id":"u_42","event":"cart_loaded","items":3}
{"level":40,"service":"checkout","request_id":"req_8f2a91","user_id":"u_42","event":"gateway_retry","attempt":2}Both lines carry the request's fields though neither call mentions them. Store the child logger on the request object (req.log in pino-http does exactly this) so every handler uses it.
- No secrets or unnecessary personal data: passwords, tokens, card numbers, full request bodies. Redact at the logger level (pino's
redactoption, for example). - One event per line, including multi-line stack traces as a single JSON string.
- Log to stdout in containers and let the platform collect and ship logs.
- Make messages human-friendly too: a short
msgfield helps when reading a single log.
Check yourself
Each value is in a named field, so tools can filter and aggregate directly without fragile parsing of free text.
Dashboards, alerts and saved queries depend on them. Renaming user_id to userId silently breaks those consumers, with no error, until someone needs them during an incident. Agree on a schema, such as OpenTelemetry semantic conventions.
Once, at the start of the request, to a request-scoped child logger or context, so every log line written during that request carries it automatically without each call having to remember.
Create a child logger with those fields once at the start of the request and use it for every log line in that request.
JSON is easy for machines to parse and index. Locally, a pretty-printer can show the same structured logs in a readable format.