Trace Latency Analysis: Find the Slowest Span
On this page
Why the longest span isn't the problem
In a trace, the root span is always the longest: it contains everything. Its children are long too, because they contain their children. Looking for "the longest span" leads straight to the top of the tree, which tells you nothing. What you want is the span that spent time doing its own work.
Total time vs self time in a trace
- Total time (duration): from the span's start to its end.
- Self time (exclusive time): total time minus the time covered by its children.
The lab's real checkout trace:
checkout   POST                                   233 ms
  checkout   request handler - /checkout          232 ms
    checkout   GET  (call to inventory)           133 ms   self ~8 ms (network, connection)
      inventory  GET                              125 ms
        inventory  request handler - /inventory/:sku  124 ms   <- self ~124 ms: the 120 ms sleep lives here
    checkout   charge_card                         81 ms   <- self 81 ms: the payment step
The request handler's 232 ms is almost entirely its children. The work happens in inventory's handler (about 124 ms of its own) and in charge_card (81 ms). Those are the two places to optimize. A bigger example of the same reading:
checkout-service           total 2.30 s   self 0.05 s   <- waiting on children
  inventory-service        total 1.80 s   self 0.10 s   <- still mostly waiting
    db SELECT inventory    total 1.70 s   self 1.70 s   <- the bottleneck: high self time
  payment-service          total 0.30 s   self 0.30 s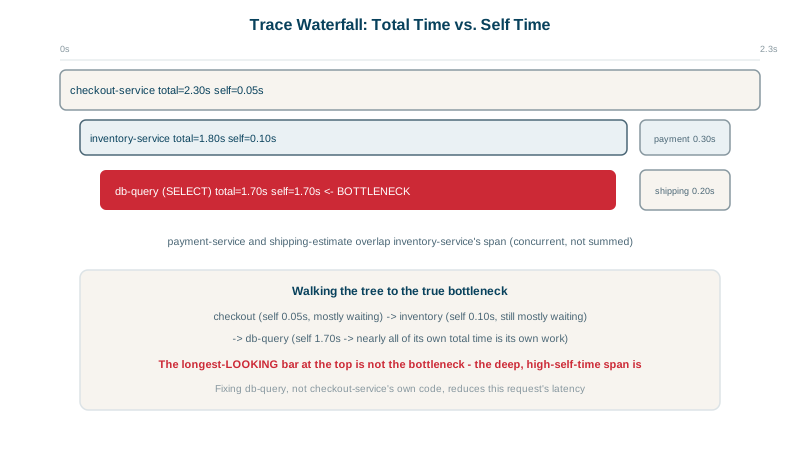
The critical path
When children run in parallel, only the longest branch decides the total. The critical path is the chain of spans that determined the end-to-end time. Speeding up a span off the critical path does nothing for the user. Many trace viewers highlight it.
Trace shapes that reveal common problems
| Shape in the waterfall | Likely problem | Fix |
|---|---|---|
| A staircase of calls that start only after the previous ends, but don't depend on each other | Sequential calls that could be parallel | Run them concurrently |
| A comb of dozens of identical short database spans | N+1 queries | Batch or join (see the API design course on DataLoader) |
| The same call repeated with growing gaps | Retries with backoff | Find why the first attempt fails; check retry budgets |
| A gap with no child spans | Uninstrumented work, CPU-bound code, lock waits, garbage collection | Add a span, or use a profiler |
| Long span to a connection pool or queue | Waiting for a resource | Check saturation (USE, Day 6) |
From one trace to many: confirming the pattern
One trace can mislead: it might be an outlier with an unusual cause. Confirm across many:
- Compare slow and fast traces for the same endpoint: what's different (an attribute value, a branch taken, a dependency)?
- Aggregate span durations by name and attribute ("p99 of
db SELECT inventorybydb.namespace"), which tools like Tempo's TraceQL, Honeycomb and Jaeger's analytics support. - Check the metric for the suspect operation to see whether it's broadly slow.
Check yourself
Its duration includes all of its child spans, so it's always at least as long as everything beneath it. The bottleneck is the span with high self time, where work actually happened, or a long chain of sequential calls.
The chain of spans that determined the total duration of the request. Work running in parallel off that path doesn't affect the total, so speeding it up gains nothing; optimize spans on the critical path.
An N+1 query pattern: one query per item instead of a single batched query. Each is fast, but together they add 200 ms. Batch them into one query with IN, a join or a DataLoader.
One trace may be an outlier. Comparing slow and fast traces, or grouping spans by attribute, shows whether the pattern explains the slowdown.