Prometheus Alerting Rules and Alert Fatigue
On this page
What is alert fatigue?
A team gets 40 alerts a night. Most resolve by themselves: CPU spikes, a disk at 81%, a single failed health check. Soon nobody looks closely, and the one alert that mattered is acknowledged and ignored. Alert fatigue is a reliability problem: too many alerts make real ones invisible.
Writing Prometheus alerting rules
An alerting rule is a PromQL expression that fires when it returns results:
groups:
  - name: checkout
    rules:
      - alert: CheckoutHighErrorRate
        expr: job:http_requests:error_ratio_rate5m{job="checkout"} > 0.05
        for: 5m
        labels:
          severity: page
        annotations:
          summary: "Checkout error rate is {{ $value | humanizePercentage }}"
runbook_url: "https://runbooks.example.com/checkout/high-error-rate"expr: the condition, here more than 5% of checkout requests failing.for: 5m: the condition must hold continuously for 5 minutes before firing, filtering out blips. While waiting, the alert is "pending".labels: used by Alertmanager for routing (severity: pageversusticket).annotations: human context; every paging alert should link a runbook.
Alert on symptoms, not causes
| Cause-based (avoid paging on) | Symptom-based (page on) |
|---|---|
| CPU above 90% | Error rate above the SLO threshold |
| One pod restarted | Users can't log in |
| Disk 80% full | p99 latency above the target |
| Queue length 1,000 | Oldest message older than 10 minutes |
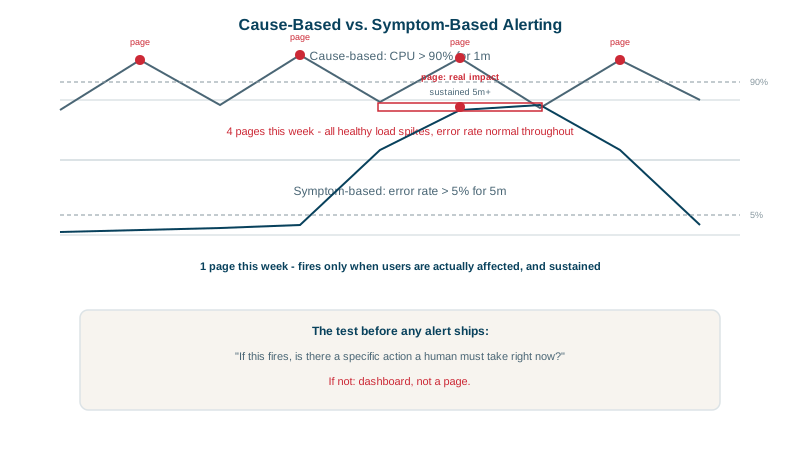
High CPU with happy users needs no human at 3 a.m. Users failing to check out does, whatever the cause. Cause metrics belong on dashboards and in low-urgency tickets. Exceptions: predictive alerts where waiting guarantees an outage, such as "disk will be full in 4 hours" (predict_linear), and certificate expiry. A disk alert that predicts instead of reacting:
predict_linear(node_filesystem_avail_bytes{mountpoint="/"}[6h], 4 * 3600) < 0It fits a straight line through the last 6 hours of free space and fires if that line reaches zero within 4 hours. A disk sitting at 85% for months never fires; one filling quickly fires while there's still time to act.
Unit-testing alerts with promtool
Alerts that never fire, or fire constantly, are both bugs. promtool test rules feeds synthetic series into rules and checks when they fire. For an SLO burn-rate alert built on the same principles (Day 23), a test asserting that a two-minute burst of errors does not page passed:
$ promtool test rules slo-alerts_test.yml
  SUCCESS
Run these tests in CI with your rule files, so a typo in a label or threshold fails the build instead of silently disabling paging.
Keeping alerts healthy
- Every page must be actionable, urgent and real. If the responder's answer is "wait and see", it isn't a page.
- Review alerts regularly: for each, how often it fired, how often it led to action, and whether a real incident was missed.
- Delete or downgrade alerts that never lead to action.
- Group related alerts in Alertmanager, so one outage produces one notification, not 200 (Day 24).
- Alert on the absence of data for critical signals (
absent()), so a broken exporter doesn't look like a healthy service. - Prefer SLO burn-rate alerts for user-facing services (Day 23): they encode "how bad and how fast".
Check yourself
It requires the condition to stay true for a set duration, such as 10 minutes, before the alert fires. Brief spikes resolve on their own without paging anyone, at the cost of a slightly slower alert.
Error rate reflects user impact directly. High CPU often causes no harm and can be normal under load, so paging on it creates noise that trains people to ignore pages.
Unit-test it with promtool test rules, feeding synthetic series and checking exactly when it fires and when it doesn't. Run the tests in CI so changes to rules can't silently break them.
A clear summary, the impact on users, a link to a dashboard and a runbook, so the responder knows what to do at 3 a.m.
Review pages regularly, delete or fix alerts that fired without needing action, and track how many pages each rotation receives.