What Is OpenTelemetry? A Vendor-Neutral Standard
On this page
What is OpenTelemetry?
Every observability vendor used to ship its own agent and API. Instrument your code for one, and switching meant touching every service. OpenTelemetry (OTel), a CNCF project formed in 2019 from the merger of OpenTracing and OpenCensus, standardizes how telemetry is produced and transported. Nearly every vendor and open-source backend now accepts it.
OpenTelemetry components: API, SDK, OTLP, Collector
- API: what your code calls to create spans and metrics. Stable and small, safe to depend on in libraries.
- SDK: the implementation: sampling, batching, exporting. Configured once per service.
- Instrumentation libraries: automatic spans and metrics for HTTP frameworks, gRPC, database drivers, Kafka and Redis clients, and more.
- OTLP: the OpenTelemetry Protocol, over gRPC or HTTP.
- Collector: a separate process that receives, processes (batching, sampling, redaction, enrichment) and exports telemetry to one or more backends.
- Semantic conventions: standard attribute names (
http.request.method,db.system.name,service.name), so dashboards and tools understand data from any language.
Instrumenting a Node.js service with OpenTelemetry
The lab's services load this file before the application (node --import ./tracing.mjs app.mjs):
import { NodeSDK } from '@opentelemetry/sdk-node';
import { getNodeAutoInstrumentations } from '@opentelemetry/auto-instrumentations-node';
import { OTLPTraceExporter } from '@opentelemetry/exporter-trace-otlp-http';
import { resourceFromAttributes } from '@opentelemetry/resources';
import { ATTR_SERVICE_NAME } from '@opentelemetry/semantic-conventions';

const sdk = new NodeSDK({
  resource: resourceFromAttributes({ [ATTR_SERVICE_NAME]: process.env.SERVICE_NAME }),
  traceExporter: new OTLPTraceExporter(),          // defaults to http://localhost:4318/v1/traces
  instrumentations: [getNodeAutoInstrumentations()],
});
sdk.start();
With no other code changes, the two lab services produced connected traces across HTTP: server spans, client spans, Express handler spans, and a propagated traceparent (Day 16). The one manual span (charge_card) added business meaning. Java (agent), Python (opentelemetry-instrument), .NET and Go offer similar setups; most settings can also come from standard environment variables such as OTEL_SERVICE_NAME and OTEL_EXPORTER_OTLP_ENDPOINT.
The OpenTelemetry Collector: switch backends without code changes
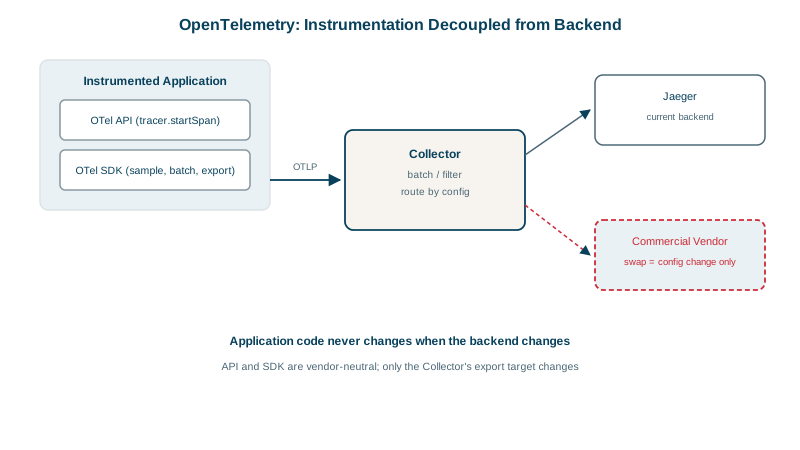
Applications send OTLP to a collector; the collector decides where data goes. Evaluating a new vendor alongside the current backend is a config change. This file passes otelcol-contrib validate:
receivers:
  otlp:
    protocols:
      grpc:
        endpoint: 0.0.0.0:4317
      http:
        endpoint: 0.0.0.0:4318

processors:
  batch: {}
  resource:
    attributes:
      - key: deployment.environment.name
        value: production
        action: upsert

exporters:
  otlp/tempo:                       # current backend
    endpoint: tempo.observability:4317
    tls:
      insecure: true
  otlphttp/vendor:                  # new backend, evaluated in parallel
    endpoint: https://otlp.vendor.example.com
    headers:
      api-key: ${env:VENDOR_API_KEY}

service:
  pipelines:
    traces:
      receivers: [otlp]
      processors: [resource, batch]
      exporters: [otlp/tempo, otlphttp/vendor]
Every span goes to both backends; drop one exporter to finish the migration. Collectors also hold API keys (so applications don't), redact sensitive attributes, and do tail sampling (Day 18).
Collector deployment patterns: agent and gateway
- Agent: a collector next to each workload (a DaemonSet in Kubernetes, or a sidecar), collecting host metrics and logs too.
- Gateway: a central collector pool that applies policy, sampling and routing before export.
- Many setups use both: agents forward to gateways.
Check yourself
Code uses the vendor-neutral API and sends data over OTLP. Switching backends, or sending to two during a migration, is a collector or exporter configuration change, not a rewrite of instrumentation across every service.
Spans, and often metrics, for common frameworks and clients, such as HTTP servers, database drivers and messaging libraries, including context propagation between services. You add manual spans for business logic.
Batching and retrying exports, sampling, redacting sensitive attributes, adding resource attributes like cluster and environment, and holding backend credentials so applications don't need them.
Agents run next to applications, on each node or as sidecars; gateways are a central pool that receives from agents and handles tail sampling and export.
Standard attribute names, like http.request.method and db.system, so telemetry from different services and libraries can be queried the same way.