Prometheus Architecture Explained
On this page
What is Prometheus?
Prometheus began at SoundCloud in 2012 and became the second project to graduate from the CNCF after Kubernetes. Its data model and query language, PromQL, are now the common language of metrics: many other systems (Thanos, Mimir, VictoriaMetrics, Grafana Cloud, Amazon Managed Prometheus) accept the same queries.
Prometheus components: targets, server, Alertmanager, Grafana
- Targets expose current metrics at an HTTP endpoint, usually
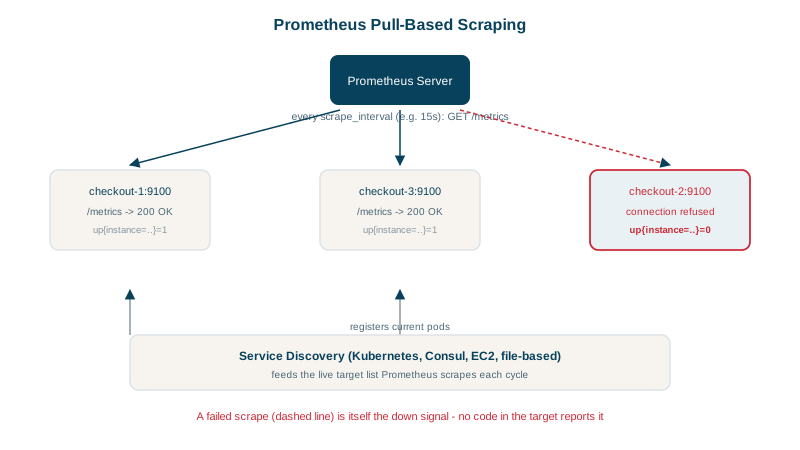
/metrics, in a simple text format. Your services do this with a client library; exporters do it for systems you can't change (node_exporter for Linux hosts, postgres_exporter, blackbox_exporter for probing URLs). - The Prometheus server scrapes each target every interval (15 to 60 seconds is typical), stores samples in its local TSDB (time-series database, a store built for appending timestamped numbers and reading ranges of them back), and evaluates recording and alerting rules. "Scraping" is just an HTTP GET of
/metrics, reading the current values, like a meter reader visiting every house on a schedule. - Alertmanager receives firing alerts, groups and deduplicates them, silences them during maintenance, and routes them to Slack, PagerDuty or email (Day 24).
- Grafana (or Prometheus's own UI) queries the server with PromQL for dashboards.
A Prometheus scrape config, validated
The configuration used for this course's lab, validated with promtool:
global:
  scrape_interval: 5s          # short for a lab; 15s to 60s is typical in production
scrape_configs:
  - job_name: checkout
    static_configs:
      - targets: ["127.0.0.1:9101", "127.0.0.1:9102"]
rule_files:
- rules.yml$ promtool check config prometheus.yml
Checking rules.yml
SUCCESS: 1 rules foundPrometheus adds job and instance labels to every scraped series, and an up metric per target (1 if the scrape succeeded), which is the simplest health check there is: up == 0.
Prometheus service discovery in Kubernetes
Static target lists don't survive autoscaling. Prometheus discovers targets from Kubernetes, EC2, Consul, DNS and files:
scrape_configs:
  - job_name: kubernetes-pods
    kubernetes_sd_configs:
      - role: pod
    relabel_configs:
      - source_labels: [__meta_kubernetes_pod_annotation_prometheus_io_scrape]
        action: keep
        regex: "true"
In Kubernetes, most teams use the Prometheus Operator, where ServiceMonitor and PodMonitor resources declare what to scrape.
Why Prometheus pulls metrics
- Prometheus knows when a target is down (the scrape fails), which push systems can't distinguish from "quiet".
- Targets don't need to know where monitoring lives; you can run a second Prometheus against the same targets for testing.
- You can open
/metricsin a browser to debug.
Pull has costs too, covered on Day 13: short-lived jobs and targets behind NAT need other approaches.
Prometheus limits to know
- A single server is not clustered. For high availability, run two identical Prometheus servers; Alertmanager deduplicates their alerts.
- Local storage is for days or weeks. Long-term, global views need remote storage like Thanos or Mimir (Day 14).
- Cardinality is the main scaling limit (Day 7).
- Metrics only. Logs and traces need other tools, linked by labels and exemplars (Day 19).
Check yourself
Its scrape fails, and Prometheus sets the synthetic up metric for that target to 0. Alerting on up == 0 for a few minutes catches dead targets; push systems have no equivalent built in.
It groups related alerts into one notification, deduplicates alerts from redundant Prometheus servers, applies silences and inhibitions, and routes alerts to channels like PagerDuty, Slack or email by label.
Run two identical Prometheus servers scraping the same targets, so one can fail without losing alerts, and let Alertmanager deduplicate their duplicate alerts. Use remote storage like Thanos or Mimir for long-term durability and a single query view.
In Kubernetes and cloud environments, instances come and go constantly. Discovery keeps the target list current automatically, using labels to select what to scrape.