Grafana Dashboard Design Best Practices
On this page
Why most dashboards don't answer questions
During an incident, someone opens the team dashboard: 40 panels in alphabetical order, cache hit ratio next to GC pauses next to error rates for services nobody remembers. Everything is a little red. Five minutes later, they still don't know whether checkout is broken.
A good dashboard answers a specific question in seconds, and leads to the next question.
Designing dashboards in layers
Layer 1: overview. One row per service, showing RED (Day 6): request rate, error rate, p99 latency, and SLO status. Color only where it means something (budget burning, error ratio above target). Answers: which service is unhealthy?
Layer 2: service detail. For one service: RED per endpoint, dependencies' latency and errors, deploy markers, saturation of its key resources (Day 6's USE). Answers: which part of this service?
Layer 3: component drill-down. Database pool, cache, queue consumers, runtime internals (GC, event loop lag, threads). Answers: which resource?
Link them: clicking a service on the overview opens its detail dashboard with the same time range; Grafana's data links and variables do this.
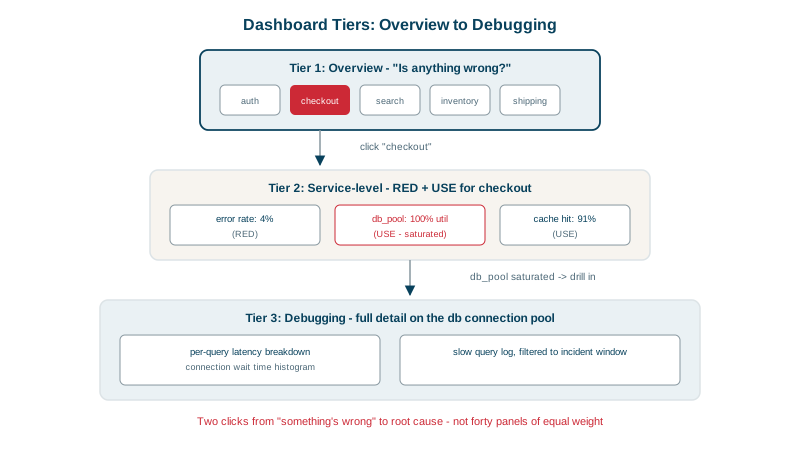
Grafana panels that work for operations
- Time series for rates, ratios and latency percentiles over time.
- Heatmaps for latency histograms: they show the whole distribution, including bimodal patterns that a single p99 line hides (like the two-speed traffic in Day 10's lab).
- Single stats for current SLO status and error budget remaining.
- Annotations for deploys and incidents on every time series panel, so "it started at the 14:30 deploy" is visible at a glance (see the CI/CD course on deploy markers).
- Avoid pie charts and gauges for operational data; they show one moment and hide trends.
Making each dashboard panel honest
- Titles that say what and how: "Checkout p99 latency (5m window)" rather than "Latency".
- Units on every axis (seconds, requests per second, percent).
- Consistent time ranges and colors: errors are always the same color across dashboards.
- Show the threshold that matters, such as the SLO target, as a line.
- Percentiles, not averages, for latency (Day 10).
- Rates, not raw counters (Day 9).
Keeping dashboards maintained as code
Dashboards rot: services get renamed, panels query metrics that no longer exist, new dependencies never get added.
- Dashboards as code: store them in Git as JSON, or generate them with Grafonnet, Terraform or Grafana's provisioning, and review changes.
- Templates and variables (
$service,$environment) so one dashboard serves every service consistently. - Delete unused dashboards; Grafana shows view counts.
- Review after incidents: "which panel did we wish we'd had?" Add it.
- Name an owner for each dashboard.
Check yourself
Which service, if any, is unhealthy right now, using a few signals per service like request rate, error rate, latency and SLO status. Details belong on drill-down dashboards linked from it.
It shows the whole latency distribution over time, revealing patterns like bimodal latency, where a cache miss path is much slower, or a gradual shift, that a single percentile line hides.
Changes are reviewed and versioned, dashboards stay consistent across services through shared templates, and they can be recreated after an accidental edit or deletion.
Averages hiding outliers, missing units, inconsistent time ranges across panels, stacked graphs that hide individual series, or y-axes that exaggerate small changes. A misleading panel sends responders down the wrong path during an incident.
A change in a graph right after a deploy marker points immediately at a likely cause and suggests a rollback, cutting investigation time from an hour to minutes. Without markers, responders must cross-check deploy history by hand.