Three Pillars of Observability: Metrics, Logs, Traces
On this page
Metrics vs logs vs traces: three kinds of evidence
Telemetry is the data a running system reports about itself. A car trip makes a good picture of its three main forms: the dashboard's speed and fuel gauges are metrics (numbers over time), the GPS route showing every turn and how long each stretch took is a trace, and the driver's notes ("took a detour, road closed at 14:10") are logs. Telemetry comes in three main forms. Each is cheap at some things and expensive or useless at others, which is why mature systems use all three and link them.
| Signal | What it is | Good at | Weak at |
|---|---|---|---|
| Metrics | Numbers aggregated over time: request rate, error count, latency histogram | Cheap, fast queries, trends, alerting | Detail about individual requests; high-cardinality dimensions |
| Logs | Timestamped records of events, ideally structured | Rich detail about what happened and why | Expensive at volume; hard to follow across services |
| Traces | One request's path through services, as a tree of timed spans | Where time went and which service failed | Sampling means not every request is kept; less useful for aggregate trends |
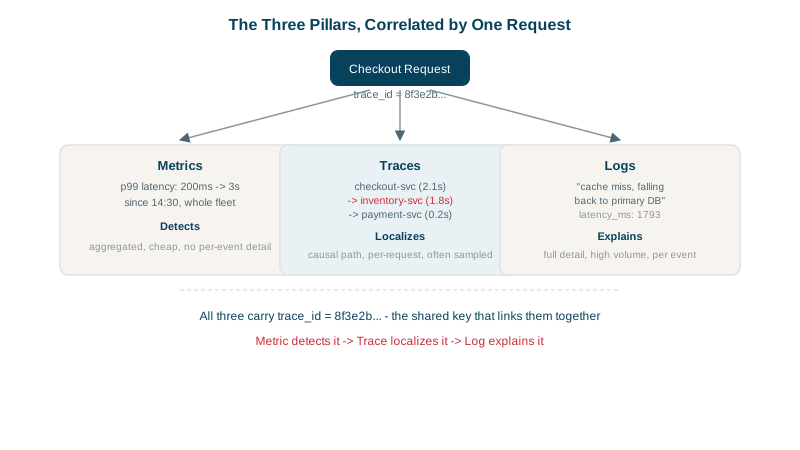
How metrics, traces and logs work together in an investigation
An investigation usually moves through them in order:
1. Metrics detect. The checkout p99 jumped at 14:30:
histogram_quantile(0.99,
  sum by (le) (rate(http_request_duration_seconds_bucket{route="/checkout"}[5m])))
2. Traces localize. One slow trace shows where the time goes:
checkout-service       2.10 s
  inventory-service    0.15 s
  payment-service      1.90 s
    POST acme-pay      1.85 s   <- the slow part
3. Logs explain. The payment service's logs for that trace ID:
{"level":"warn","service":"payment","trace_id":"8f3e2b...","event":"gateway_retry",
 "attempt":3,"gateway":"acme-pay","error":"connection reset","duration_ms":610}
The payment gateway is resetting connections and the client retries three times. Each signal answered a different question: is something wrong, where, and why.
Beyond the three pillars: profiles, wide events and RUM
The "three pillars" are a useful starting map, not a law:
- Profiles (continuous profiling) show which functions use CPU and memory, sometimes called the fourth signal; OpenTelemetry added profiling support.
- Events with many attributes (sometimes called "wide events") blur the line between logs and traces: one rich record per request, queryable by any field.
- Real user monitoring captures what browsers and mobile apps experience.
More important than the categories is that the signals are correlated, sharing trace IDs and resource attributes so you can move between them in a click (Day 19).
What each telemetry signal costs
- Metrics cost roughly per time series (each unique combination of labels), regardless of traffic.
- Logs cost per byte ingested and stored, so they grow with traffic.
- Traces cost per span stored, which is why they're sampled (Day 18).
Cost management (Day 26) is mostly about putting each kind of question on the cheapest signal that can answer it.
Check yourself
Metrics: they're cheap to store, pre-aggregated over time and fast to query, which suits evaluating alert rules every few seconds. Traces and logs then help explain which requests failed and why.
The causal path of one request across services, with each step's timing and parent-child relationships, without manually matching log lines by timestamp and guessing which belong together.
Logs store a record per event, so more requests mean more bytes; metrics aggregate events into a fixed number of time series.
It shows which functions use CPU and memory in production over time, explaining why a span is slow at the code level, which traces alone can't.
One structured event per request carrying many fields, such as user, route, duration, cache result and version, which can be queried flexibly like a database.