PromQL Tutorial for Beginners
On this page
PromQL selectors: instant and range vectors
A PromQL query starts with a metric name and label matchers:
http_requests_total{route="/orders/:id/checkout", status=~"5.."}=and!=match exactly;=~and!~match regular expressions ("5.."is any 5xx).- This is an instant vector: the latest value of each matching series.
- Add a range,
[5m], to get a range vector: all samples from the last five minutes, which functions likerate()need.
rate, irate and increase
rate(http_requests_total{route="/orders/:id/checkout"}[1m])rate() gives the per-second average increase over the window, handling counter resets. Related functions:
irate()uses only the last two samples: spiky, for fast-moving graphs, not for alerts.increase()gives the total increase over the window (rate × window): "how many errors in the last hour?"
Use a window of at least four scrape intervals, so each window contains enough samples.
Aggregating with sum by and without
sum by (instance) (rate(http_requests_total{route="/orders/:id/checkout"}[1m]))From the course lab, two instances under load:
{"instance": "127.0.0.1:9101"}  51.16
{"instance": "127.0.0.1:9102"} 52.36sum, avg, max, min, count and topk aggregate across series; by (label) keeps those labels, without (label) drops them.
Why rate comes before sum in PromQL
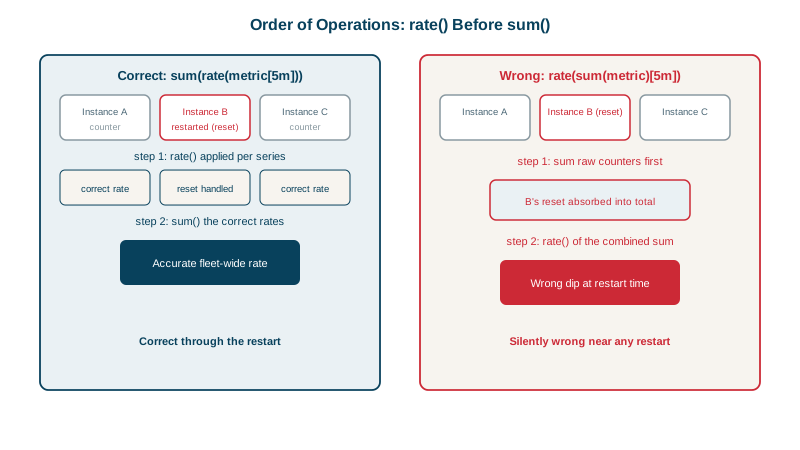
Each instance's counter resets independently when it restarts. rate() detects resets per series, so it must run before summing. A promtool test with two instances each serving 1 request per second, where one restarts:
- series: 'http_requests_total{instance="a"}'
  values: '1000+60x10'
- series: 'http_requests_total{instance="b"}'
values: '5000+60x4 60+60x5' # restarts at minute 5sum(rate(http_requests_total[5m])) -> 2 (correct: 2 req/s in total)
rate(sum(http_requests_total)[5m:1m]) -> 7.17 (wrong)Summing first creates one combined counter that drops by thousands at the restart. rate() treats that drop as a reset and counts a huge jump, overstating traffic by more than three times. The rule: rate, then aggregate.
Error ratios and arithmetic between series
Ratios are where most useful queries live. The lab's error ratio and mean latency:
sum(rate(http_requests_total{route="/orders/:id/checkout", status=~"5.."}[5m]))
/
sum(rate(http_requests_total{route="/orders/:id/checkout"}[5m]))                 # 0.01957

sum(rate(http_request_duration_seconds_sum{route="/orders/:id/checkout"}[5m]))
/
sum(rate(http_request_duration_seconds_count{route="/orders/:id/checkout"}[5m]))  # 0.1912 s
A 2% error rate and a 191 ms mean. When dividing series with different labels, use on() or ignoring() to say which labels must match, and group_left for many-to-one joins (such as adding a team label from an info metric).
Comparing with the past: offset
"Is this normal for a Tuesday afternoon?" is one of the first questions in an investigation. offset shifts a selector back in time, so you can compare now with the same moment last week:
sum(rate(http_requests_total{route="/orders/:id/checkout"}[5m]))
/
sum(rate(http_requests_total{route="/orders/:id/checkout"}[5m] offset 1w))
A result of 1.0 means the same traffic as a week ago; 0.4 means checkout traffic has dropped by 60%, which can be an outage that error rates alone miss, because requests that never arrive can't fail.
Prometheus recording rules
Expensive or frequently used queries can be precomputed every evaluation interval as new series:
- record: job:http_requests:error_ratio_rate5m
  expr: |
    sum by (job) (rate(http_requests_total{route="/orders/:id/checkout", status=~"5.."}[5m]))
    /
    sum by (job) (rate(http_requests_total{route="/orders/:id/checkout"}[5m]))
In the lab it produced 0.01969. Dashboards and alerts then query the cheap recorded series. Name them level:metric:operations.
Check yourself
Counter resets are detected per series; summing first hides each reset inside the total, which rate() then misreads as a huge increase.
rate() is the per-second average increase over the window; increase() is the total increase over the same window, effectively rate() multiplied by the window length. Use rate() for graphs and alerts, and increase() for questions like how many errors in the last hour.
It uses only the last two samples, so it's noisy and can flap; rate() over a longer window is steadier.
It shifts a query back in time, so rate(x[5m] offset 1w) compares current traffic with the same time last week.
They precompute expensive queries on a schedule and store the results as new series, making dashboards and alerts fast and consistent.