AWS CloudWatch: Metrics, Logs and Alarms
On this page
What CloudWatch does
When something breaks, you want an alert within minutes, a graph showing when it started, and logs explaining why. CloudWatch provides all three, and every AWS service already sends it data.
CloudWatch metrics, dimensions and percentiles
- A metric is a time series, like
CPUUtilizationorHTTPCode_Target_5XX_Count, in a namespace (AWS/EC2,AWS/ApplicationELB) and identified by dimensions (InstanceId,LoadBalancer). - Statistics summarize each period:
Average,Sum,Maximum, and percentiles likep99. Use percentiles for latency: an average of 120 ms can hide 2-second responses for 1 percent of users. - Your own metrics come from
PutMetricData, the CloudWatch agent, or the Embedded Metric Format, structured log lines that CloudWatch turns into metrics. - EC2 doesn't report memory or disk usage by default; install the CloudWatch agent for those.
Here's the percentile point with numbers. A thousand requests where 990 take 60 to 140 ms and 10 take around two seconds:
# p99.py: why an average latency hides slow requests
import random, statistics
random.seed(7)
latencies = [random.uniform(60, 140) for _ in range(990)] + [random.uniform(1800, 2500) for _ in range(10)]
latencies.sort()
p50 = latencies[len(latencies) // 2]
p99 = latencies[int(len(latencies) * 0.99)]
print(f"average {statistics.mean(latencies):.0f} ms | p50 {p50:.0f} ms | p99 {p99:.0f} ms | slowest {latencies[-1]:.0f} ms")average 119 ms | p50 97 ms | p99 1829 ms | slowest 2344 msThe average looks healthy, yet one request in a hundred takes nearly two seconds. That matters more than it sounds: if a page makes 20 API calls, the chance that at least one of them is slow is 1 − 0.99^20, about 18 percent, so nearly one page load in five feels slow. p50 is the typical request, p99 is the slow tail your unhappiest users see.
CloudWatch Logs and Logs Insights
- Log groups (one per application or function) contain log streams (one per instance, container or execution environment).
- Lambda, ECS with the
awslogsdriver, and API Gateway send logs automatically. - Set a retention period on every log group. The default is "never expire", and ingestion plus storage is often a surprisingly large part of the bill.
- Logs Insights queries logs with a purpose-built language:
fields @timestamp, @message
| filter level = "ERROR"
| stats count(*) as errors by bin(5m), route
| sort errors desc
Log in JSON so fields like level, route and request_id are queryable without parsing.
CloudWatch alarms that ignore one-off blips
An alarm watches one metric (or an expression) and changes state between OK, ALARM and INSUFFICIENT_DATA, triggering actions on transitions: notify through SNS, scale an Auto Scaling group, or recover an instance.
Page on a sustained problem, not a single bad minute. This alarm needs at least 3 of the last 5 one-minute periods with more than 20 server errors (run against a local AWS emulator):
aws cloudwatch put-metric-alarm \
  --alarm-name api-5xx-high \
  --namespace AWS/ApplicationELB --metric-name HTTPCode_Target_5XX_Count \
  --dimensions Name=LoadBalancer,Value=app/web-alb/50dc6c495c0c9188 \
  --statistic Sum --period 60 \
  --evaluation-periods 5 --datapoints-to-alarm 3 \
  --threshold 20 --comparison-operator GreaterThanThreshold \
  --treat-missing-data notBreaching \
  --alarm-actions arn:aws:sns:us-east-1:123456789012:oncall

aws cloudwatch put-metric-alarm \
  --alarm-name api-p99-latency-high \
  --namespace AWS/ApplicationELB --metric-name TargetResponseTime \
  --dimensions Name=LoadBalancer,Value=app/web-alb/50dc6c495c0c9188 \
  --extended-statistic p99 --period 60 \
  --evaluation-periods 5 --datapoints-to-alarm 3 \
  --threshold 1.5 --comparison-operator GreaterThanThreshold
--treat-missing-data notBreaching matters for count metrics: when there are no errors, the load balancer reports no data points at all, which shouldn't count as a problem.
A composite alarm combines alarms with a rule, so you page only when signals agree (validated client-side; the emulator doesn't support it):
aws cloudwatch put-composite-alarm --alarm-name api-degraded \
  --alarm-rule 'ALARM("api-5xx-high") AND ALARM("api-p99-latency-high")' \
  --alarm-actions arn:aws:sns:us-east-1:123456789012:oncall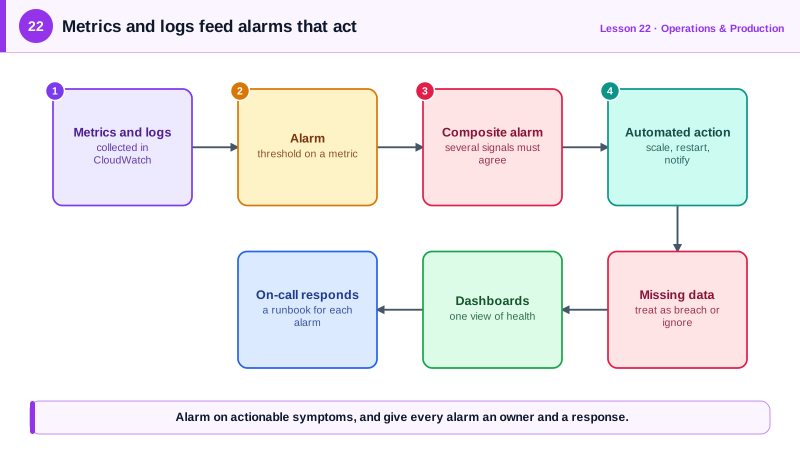
What to alarm on
- Symptoms users feel: error rate, latency percentiles, failed health checks, queue age. These page someone.
- Causes: CPU, memory, disk, connection counts. Put these on dashboards and in low-urgency notifications; high CPU with happy users isn't an emergency.
- Every alarm needs an owner and a runbook. An alarm nobody acts on trains people to ignore alarms.
- Anomaly detection alarms learn a metric's normal pattern (with daily and weekly cycles) for metrics without a fixed threshold.
Beyond the basics: Container Insights and Application Signals add container and service-level views, Synthetics canaries test user flows on a schedule, and X-Ray traces requests across services.
Check yourself
The average hides slow requests: a few 5-second requests barely move it. p99 shows the experience of the slowest 1 percent, which for a busy service is many real users, and often your most active ones.
The alarm fires only if 3 of the last 5 periods breach the threshold. One-off spikes don't page anyone, but a sustained or recurring problem still triggers the alarm within a few periods.
Log groups without a retention setting, which keep every log line forever and grow storage costs monthly, and noisy log ingestion, such as debug logging left on. Set retention on every log group and reduce chatty logs.
A high percentile such as p99. The average blends many fast requests with a few slow ones, and pages that make many calls hit those slow ones often.