Latency vs Throughput in System Design
On this page
Why average response time hides slow requests
Your dashboard says the average response time is 80 ms. Support says customers see checkout hang for seconds. Both are true. The average hides the slow requests, and at scale "rare" slow requests happen to thousands of people a day.
Latency vs throughput: what each measures
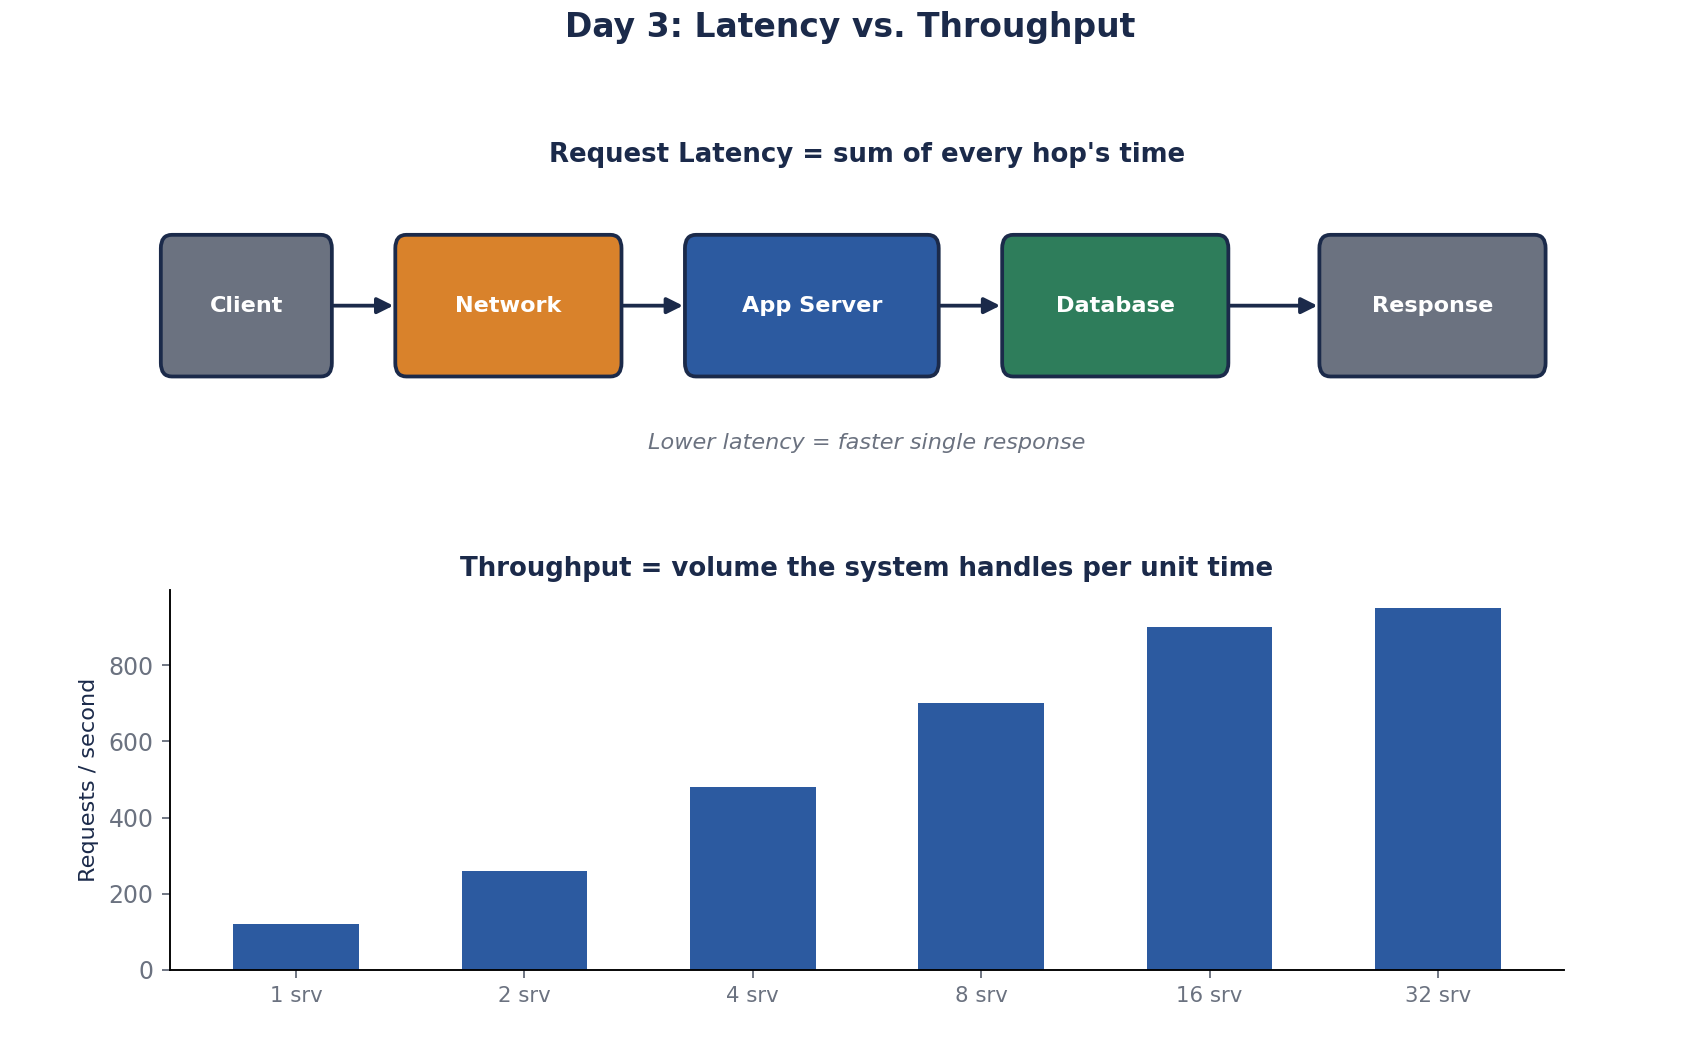
- Latency: how long one request takes, end to end: network, application code, database, response.
- Throughput: how many requests the system completes per second.
They're related but not the same. A system can have low latency and low throughput (fast, but can't handle many at once) or high throughput and high latency (a batch system that processes huge volumes slowly).
Percentiles: p50, p95 and p99 latency
Sort a minute's worth of request times. The p50 (median) is the middle one. p95 is the time 95 percent of requests beat; p99 is the time 99 percent beat. The p95 and p99 describe the tail: the slowest requests.
Say an endpoint shows:
p50 = 40 ms p95 = 180 ms p99 = 900 msThe median says the code path is fine. The p99 says 1 in 100 requests takes almost a second. At 1,000 requests per second, that's 10 slow requests every second. Common causes: garbage collection pauses, lock contention in the database, a cold cache, or one slow downstream call.
Tail latency compounds. A page that makes 10 backend calls in parallel is as slow as the slowest one. If each call is slow 1 percent of the time, the page is slow 1 − 0.99^10 ≈ 10 percent of the time. Google's "The Tail at Scale" works the same math for a request fanning out to 100 servers: 63 percent of requests hit at least one slow server (Dean and Barroso, 2013).
Two traps when reading percentiles:
- You can't average them. The mean of four servers' p99s is not the fleet's p99. Collect histograms and compute the percentile over all requests; Prometheus histograms (Day 87) do this.
- Where you measure matters. Server-side timing starts when your code gets the request. Time spent queued in the load balancer, in the thread pool, or on the network isn't in it. Measure at the client or the load balancer too.
When someone quotes a latency number, ask "which percentile, measured where?"
Little's Law: how latency and throughput connect
Little's Law connects the two metrics: L = λ × W. L is the average number of requests in the system at once, λ is the arrival rate (throughput), and W is the average time each spends inside (latency).
A checkout API must handle 500 requests per second, and each takes 0.2 seconds:
L = 500 requests/s × 0.2 s = 100 requests in flight at any momentSo the system needs room for at least 100 concurrent requests: worker threads, database connections and so on, plus headroom for peaks. If latency doubles to 0.4 seconds because the database slowed down, the same traffic needs 200 concurrent slots. That's why a slow database often shows up as "the app servers ran out of threads".
Why latency explodes near 100 percent utilization
Latency doesn't stay flat as load rises. Once a server is busy, new requests wait in a queue, and the wait grows faster than the load. In the simplest queueing model (one server, random arrivals), the average wait in the queue is utilization / (1 − utilization) times the time to serve one request:
50% busy  ->  wait ≈ 1 × service time
80% busy  ->  wait ≈ 4 ×
90% busy  ->  wait ≈ 9 ×
95% busy  ->  wait ≈ 19 ×
Real systems don't follow the formula exactly, but the shape holds: a hockey stick. That's why capacity plans target 60 to 70 percent at peak instead of 95, and why the p99 starts climbing well before CPU hits 100 percent.
Latency vs throughput trade-offs
- Batching raises throughput, because one database round trip handles many items, but each item waits for the batch.
- Fanning out in parallel lowers latency for one request, but uses more resources per request, which lowers how many you can handle in total.
Know which one your requirement is about before optimizing. Checkout cares about p99 latency; a nightly import cares about throughput.
Check yourself
The p99. At high volume, 1 percent is many users, and pages that call the endpoint several times hit the slow tail even more often.
By Little's Law, L = λ × W = 200 × 0.5 = 100 requests in flight on average. Thread pools, connection pools and concurrency limits must handle at least that, with headroom for bursts and slower requests. If latency doubles to one second, the in-flight count doubles to 200, which is why slowdowns exhaust pools.
Probably not. Near full utilization, queueing time grows sharply and hits the tail first. Add capacity to bring peak utilization back to around 60 to 70 percent.
It's an average of percentiles, which isn't a percentile. Compute p99 from the combined histogram of all requests; it will be dominated by the slow server.
Latency is how long one request takes from start to finish. Throughput is how many requests the system completes per unit of time. You can raise throughput with more workers while latency stays the same, or cut latency for one request without changing throughput.