Client-Server Architecture and the Request Lifecycle
On this page
What happens when a browser calls an API
An Angular app calls GET /api/products/123. The response arrives in 120 ms. Where did those 120 ms go? Most developers can describe their controller code in detail and the rest of the path only vaguely. Yet most of the latency, and most of the places you can remove it, live in the rest of the path.
What is client-server architecture?
In a client-server architecture, the client (a browser, a mobile app or another service) starts a request, and the server answers. HTTP is stateless: the server remembers nothing between requests, so the client sends its identity (a cookie or a token) every time. That's the same statelessness that makes horizontal scaling possible (Day 2).
The request lifecycle, hop by hop
1. DNS lookup         api.shop.example  -> 203.0.113.10        (often cached)
2. TCP handshake      one round trip to open a connection
3. TLS handshake      one more round trip with TLS 1.3 (two with TLS 1.2)
4. HTTP request       sent to the load balancer
5. Load balancer      picks a healthy app server, forwards the request
6. App server         auth, routing, business logic
7. Cache lookup       Redis: product:123 ?
8. Database query     only on a cache miss
9. Response           back through the same chain
On a phone with 60 ms of network round trip, steps 2 and 3 alone cost 120 ms on a brand-new connection, before your code runs at all. That's why browsers and HTTP clients reuse connections, and why HTTP/2 and HTTP/3 (Day 13) put a lot of effort into reducing handshakes.
TLS usually ends at the load balancer. Behind it, the load balancer keeps its own pool of open connections to the app servers, so the expensive handshakes happen once per user connection, not once per hop. Whether that inner hop is re-encrypted is a security decision (Day 84).
Where did the 120 ms go?
Here is one plausible breakdown for the opening request on a reused connection, with a 40 ms network round trip:
Network round trip, browser <-> load balancer   40 ms
Load balancer                                    1 ms
ASP.NET Core middleware, auth, routing           5 ms
Redis lookup (miss)                              1 ms
SQL query                                       55 ms
JSON serialization and response                  3 ms
Download of a 200 KB response on a slow link    15 ms
Total                                         ~120 ms
Your numbers will differ. The point is that you can measure every line. The browser's DevTools Network tab splits each request into DNS, connection, TLS, waiting and download time. Add a Server-Timing response header with your own server-side timings, such as Server-Timing: db;dur=55, cache;dur=1, and DevTools shows those too. Now you know the query is half the time, before you touch the controller.
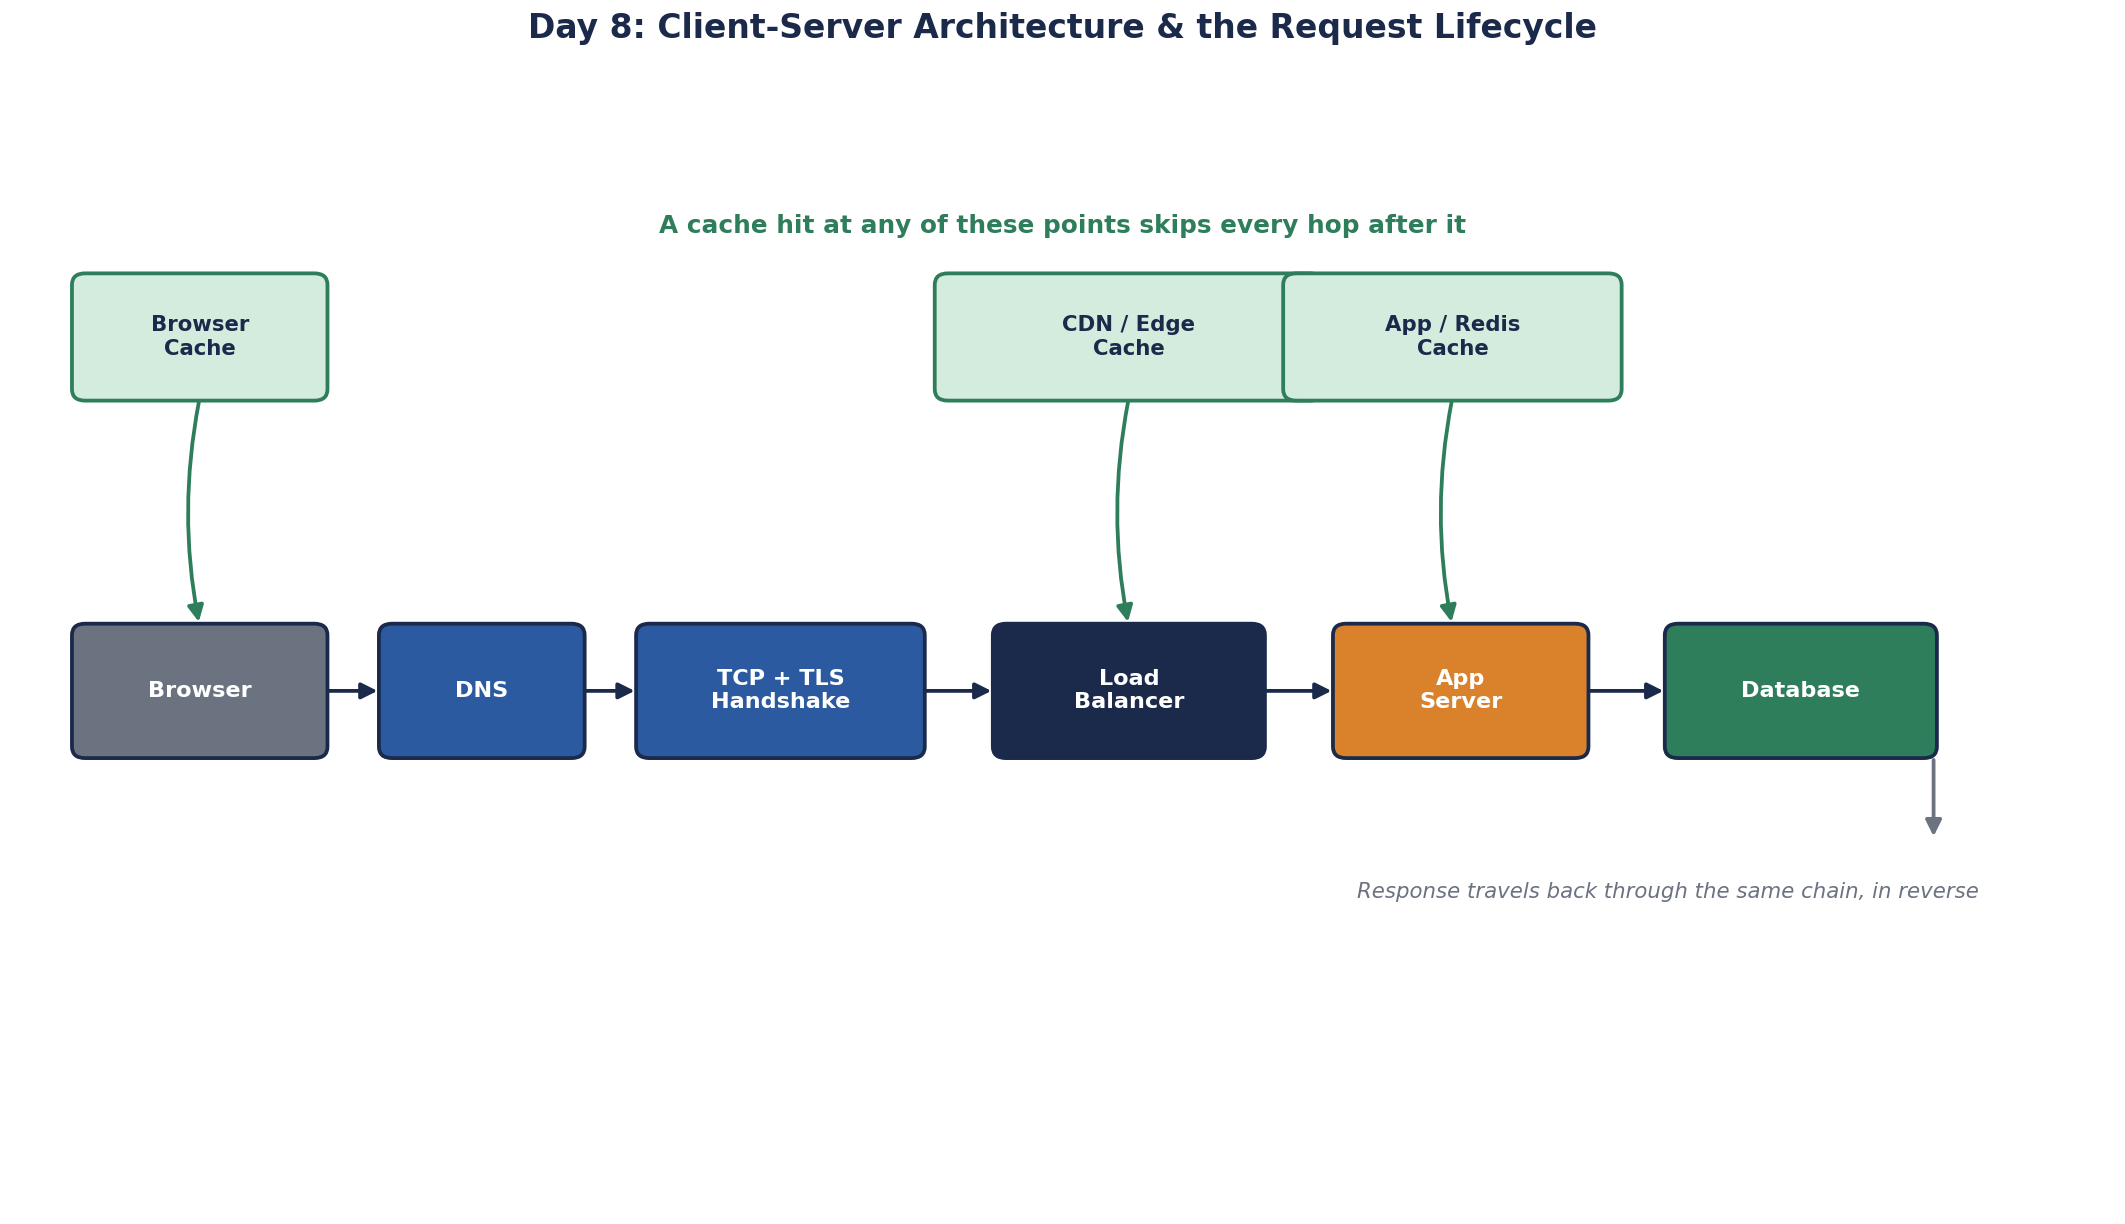
Where caching shortens the request
Each cache along the path removes everything behind it:
| Cache | Where | What it saves |
|---|---|---|
| Browser cache | On the device | The whole network trip |
| CDN | Edge location near the user | The trip to your origin servers |
| Application cache (Redis, in-memory) | Next to the app servers | The database query |
| Database buffer cache | Inside the database | The disk read |
For product 123: on a cache miss, the app queries the database, stores the result in Redis and returns it. On a hit, the database isn't touched. Every hit also leaves database capacity for other requests, so caching helps everyone, not just the user who got the hit.
How single-page apps change the request pattern
A classic server-rendered page, such as ASP.NET Web Forms, sends a full HTML page for most actions. A React or Angular single-page app loads its code once, then makes many small API calls returning JSON. That means many more requests, each smaller, which makes connection reuse, API latency and caching of API responses more important than page rendering time.
There's a hidden extra trip when the app and the API live on different origins, such as app.shop.example calling api.shop.example. For any request with a JSON body or an Authorization header, the browser first sends an OPTIONS CORS preflight to ask permission, then the real request. That's one more round trip. Return Access-Control-Max-Age so the browser caches the answer; Chromium caps it at 2 hours and Firefox at 24 hours (MDN). Or serve the API from the same origin, under /api, and the preflight disappears.
Check yourself
A CORS preflight. Return Access-Control-Max-Age so the browser caches it, or serve the API from the same origin so no preflight is needed.
The first request pays for DNS, the TCP handshake and the TLS handshake. Later requests reuse the connection and cached DNS answer.
Where the time goes. DevTools timing and a Server-Timing header split network, queueing, database and serialization time, and the controller code is often the smallest part.
The browser cache, then a CDN edge, then a reverse proxy or gateway cache, then an in-memory or distributed cache in the application, then the database's own buffer cache. Each layer closer to the user saves more round trips, but is harder to invalidate.
The first load downloads the app's JavaScript, then the browser makes many small API calls as the user interacts, instead of one full page request per click. That shifts work to the API, makes CORS and authentication tokens matter, and raises the cost of chatty endpoints.