Centralized Logging and Log Aggregation
On this page
Symptom: "check the logs" takes an hour
A customer reports a failed checkout at 14:32. The request passed through a gateway, three services and a worker, running on 40 containers, some of which no longer exist. On one server you'd tail a file. Here, the logs are scattered, some are gone, and nothing says which lines belong to this customer's request.
Three practices fix this: structured logs, correlation ids and centralized aggregation.
Structured logging
A free-text line like Payment failed for order 991 after 3 attempts can only be searched with fragile text matching. A structured log writes fields:
{"ts":"2026-10-10T14:32:07.412Z","level":"Error","service":"payments","msg":"Payment failed",
 "order_id":991,"attempts":3,"provider":"acme-pay","error_code":"card_declined",
 "trace_id":"4bf92f3577b34da6a3ce929d0e0e4736"}
Now "all failures for provider acme-pay in the last hour, grouped by error code" is a query. In .NET, ILogger with message templates ("Payment failed for {OrderId}") produces these fields; Serilog and the OpenTelemetry exporter send them as JSON.
The template is what makes it structured, and it's easy to lose:
logger.LogError("Payment failed for {OrderId} after {Attempts} attempts", orderId, attempts);   // fields: OrderId, Attempts
logger.LogError($"Payment failed for {orderId} after {attempts} attempts");                     // one opaque string
The interpolated version looks the same in a console but gives the log store no fields to query, and it builds the string even when that log level is switched off. For hot paths, the [LoggerMessage] source generator avoids the remaining overhead.
Correlation ids: following one request across services
Generate an id at the edge for each incoming request, or reuse the trace id from distributed tracing (Day 88), and include it in every log line, every outgoing call and every message published. Then one query, trace_id = 4bf92f..., returns the whole story across every service and worker, in order.
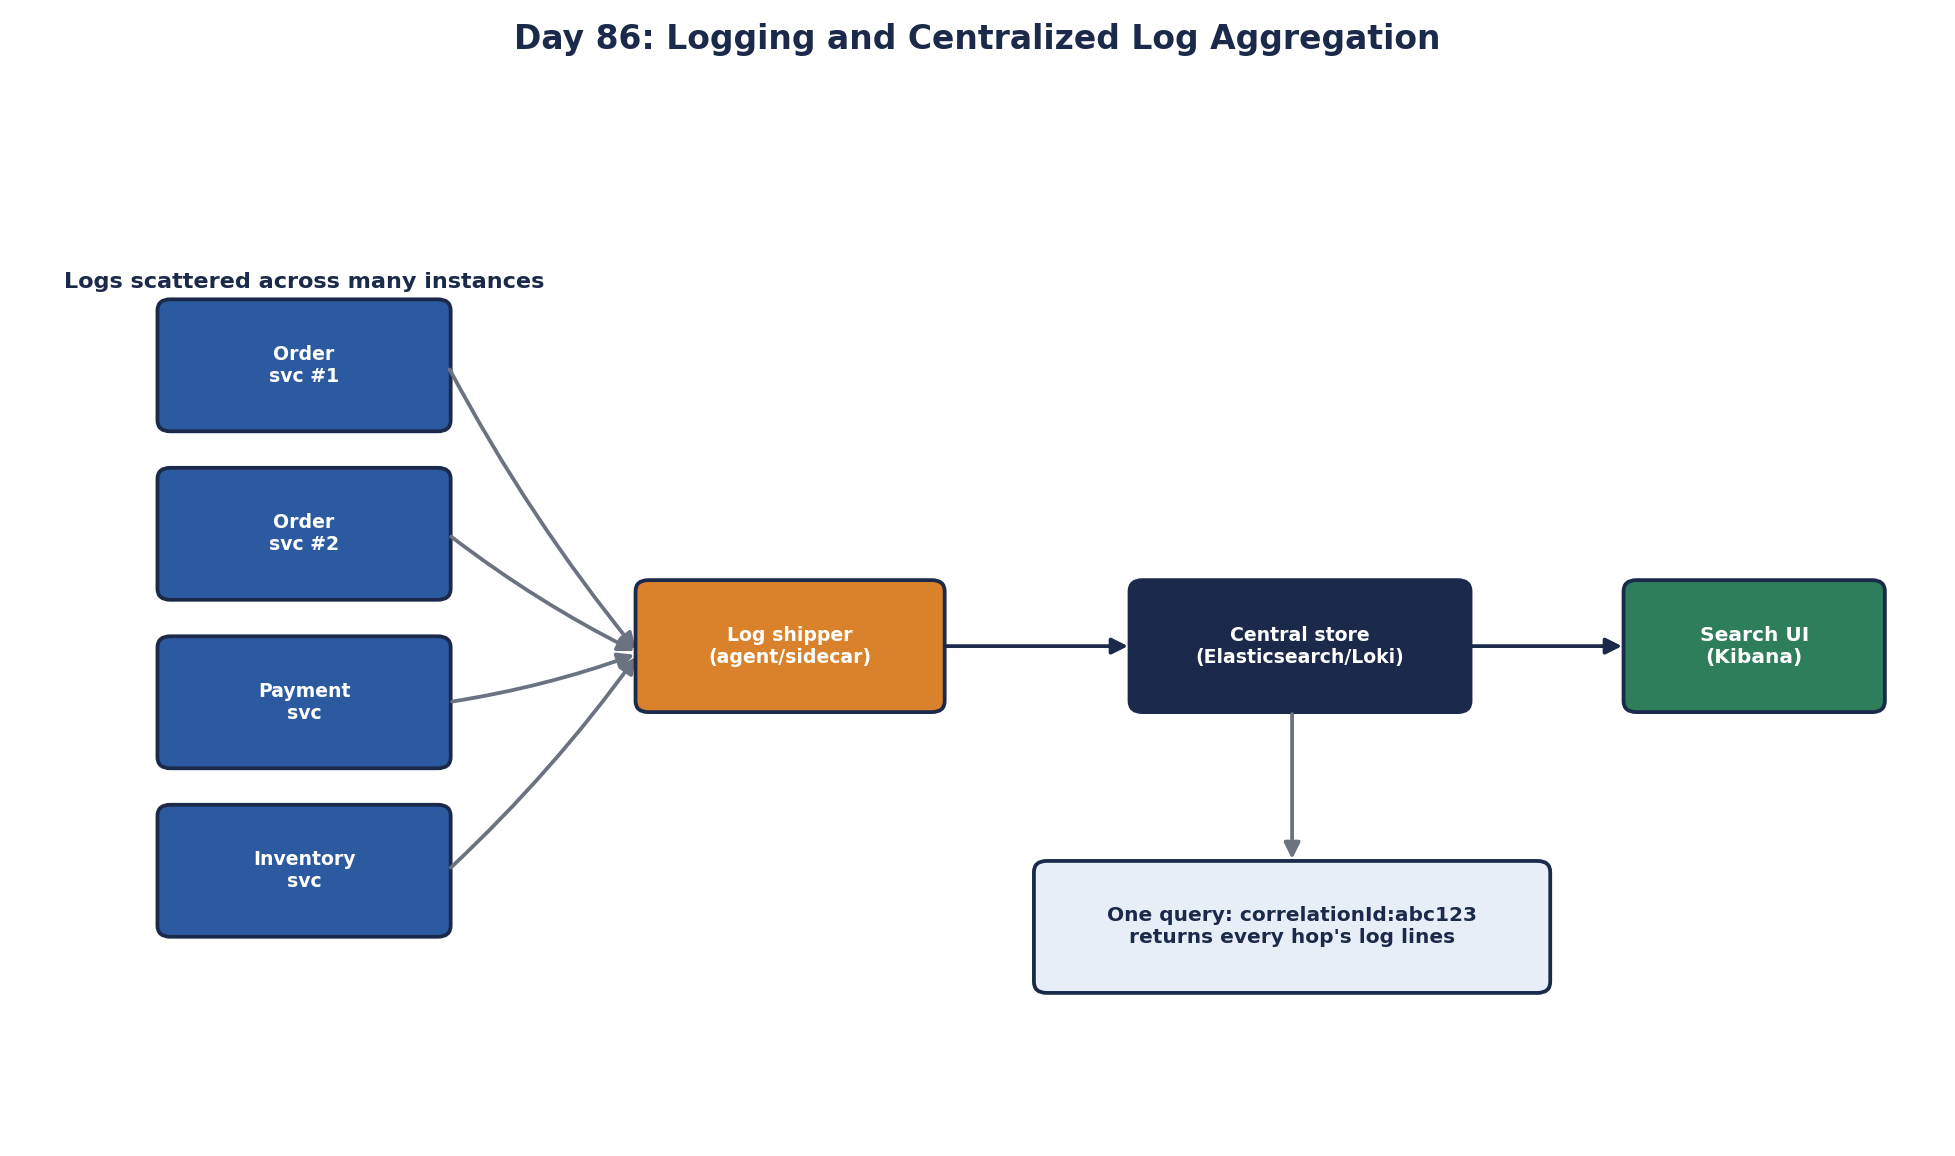
The log aggregation pipeline
The shape is similar everywhere:
- Applications write structured logs to stdout (in containers) or a local file.
- An agent on each node collects and forwards them: Fluent Bit, Vector or the OpenTelemetry Collector.
- A central store indexes them: Elasticsearch or OpenSearch with Kibana, Grafana Loki, or a managed service (CloudWatch Logs, Azure Monitor, Datadog, Splunk).
- Engineers search, build dashboards and set alerts on log patterns.
Writing to stdout and letting the platform collect keeps applications simple and survives containers disappearing. Avoid having the application send logs synchronously to a remote service: when that service is slow, every request that logs becomes slow too. If you must ship directly, use a buffered, asynchronous sink and accept that a crash may lose the last few lines.
Keep audit logs separate from these. "Who changed this user's permissions" has different rules: it must not be sampled or dropped, it may need years of retention, and engineers shouldn't be able to edit it. Write audit events to their own append-only store.
Log levels, volume and cost
Logs grow fast and log platforms charge by volume.
- Use levels deliberately: Error for failures that need attention, Warning for unusual but handled situations, Information for important business events, Debug off in production unless switched on for an investigation.
- Don't log every request body or every loop iteration.
- Sample high-volume, low-value logs (successful health checks, for example).
- Set retention per category: maybe 7 to 30 days searchable, longer in cheap archive storage for audit logs.
Never log secrets
Passwords, tokens, full card numbers and personal data in logs are a breach waiting to happen, because logs are copied widely and kept for a long time. Redact sensitive fields in the logging configuration, and test that redaction works.
Logs vs metrics vs traces
Logs tell you what happened in detail. Metrics (Day 87) tell you how much and how often, cheaply, and drive alerts. Traces (Day 88) show where time went across services. You typically go metric alert → trace → logs for the slow span.
Check yourself
String interpolation, $"... {orderId}", which produces one plain string. Use message templates with named placeholders and pass values as arguments.
Every log line for one request carries the same id across all services, so one query returns the full sequence of events.
Which service and log level grew; often a Debug or per-request log was left on, or request bodies are being logged. Reduce, sample or lower the level.
Logs are copied to many systems, kept for a long time and read by many people, so anything sensitive in them is effectively exposed. Redact authorization headers, tokens and personal data at the logger, and scan for leaks.
Metrics are cheap numbers over time that answer "is it healthy?", logs are detailed records of individual events that answer "what happened?", and traces follow one request across services to answer "where did the time go?". Incidents usually need all three.